
I always begin my presentations by making fun of myself and my past projects.
I show one of my dreadful graphs, reports, or slideshows from ten years ago, before I knew better, and then show participants how I’d edit that graph today to make it more effective.
I want to set the tone immediately that everyone makes mistakes and it’s no big deal. Laugh at yourself and move on. Even the supposed guru in front of you has used 3D distortions, red-green color palettes that are illegible for people with color vision deficiencies, and tiny Times New Roman text in barely-understandable technical gibberish.
I have five different examples that I cycle through depending on the audience: I might show a past peer-reviewed journal article disaster for an academic audience, or an evaluation disaster for an evaluation audience, or a foundation disaster for a foundation audience, and so on.
Regardless of the specific example I choose to share with each audience, the message is the same: No shame, no blame. Laugh at your past data visualization mistakes, and then move on and just focus on making improvements to the projects you’re currently working on.
I’m not the only data visualization designer with skeletons in my closet. We’ve alllll made mistakes. In this post, I pulled some of my friends together and asked them to share their past work, too. They were great sports and had fun laughing at themselves along the way, too.
And more importantly–look how far they’ve come!!! What a difference a few years of practice (or ten) can make in your own learning journey.
Kylie Hutchinson
Then


Now

Echo Rivera
Echo says, “That time I thought SmartArt was the best design option…”
Then
“This is my masters thesis defense from 2010. I think this was the first time I tried to make my own slide template, which involved adding some speech bubbles to a square and pasting it on all the slides. And, as you can see, I was a huge fan of SmartArt back then. It also has an enormous amount of text on the slides and, generally, does not look all that visually appealing.”

Now
“Luckily, I didn’t stop there! I continued to experiment and learn how to design highly visual presentations. This is a section of a workshop I created in January 2019—it’s one of my most recent presentations. As you can see, it’s much more visual and has significantly less text on each slide. It also has built-in moments for audience engagement and is, generally, a lot of fun to deliver and a blast for my audience. I now love designing presentations so much that I have a website and courses to help others make the same transformation in their slides.”

“For more of my old slides, and to check out my website, please see the original article, Blasts From the Pasts: My Old Slides (LOL).”
Sheila B. Robinson
Sheila says, “I found a good (meaning bad, of course) slide for you and I promise, this is the original and it’s from 2009!”
Then
“Unfortunately, I did no doctoring to make it worse for this purpose. Funny, this is probably one of my last really bad slides. By 2006 or 2007 or so, I knew to limit text (no complete sentences) and use larger fonts on each slide, but not much else. It was 2010 when I started really paying attention to design and learning at a much deeper level. Enjoy! :-)”

Jon Schwabish
Jon shared a 3D area chart disaster…
Then
Oh man, look what I found! One of my own graphs from a paper I published in 2007. #mydatavizsins pic.twitter.com/zUE6Pv4Bue
— Jon Schwabish (@jschwabish) July 30, 2018
Now
Jon’s blog is one of my favorite resources for data visualization best practices and advanced Excel how-tos. You can read more at policyviz.com. For example, he just published an article about developing a tile grid map for Washington, D.C. zip codes at https://policyviz.com/2019/02/14/a-tile-grid-map-of-dc/.

Elissa Schloesser
Elissa showed how her dashboard designs have changed over the past 10 years…
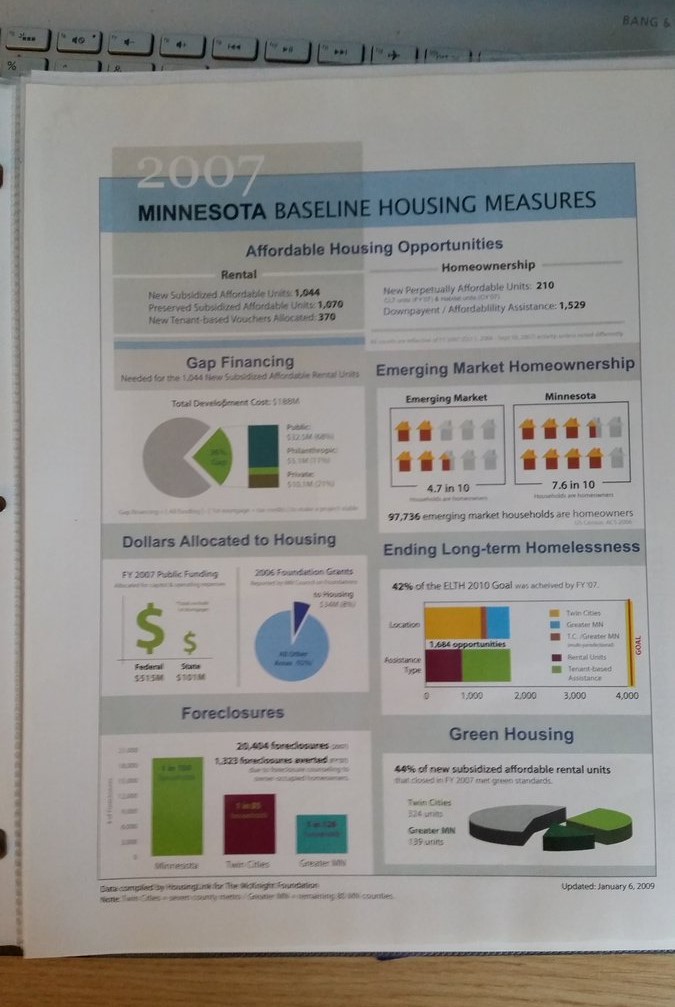
Then
“Here’s the first data dashboard I created while working at a small affordable housing nonprofit in 2008. It was the project that inspired me to start Visual Voice the following year. Although it got great feedback at the time, what was I thinking with including a 3d pie chart??”
Now
“Here’s a dashboard I designed last month. Beyond not including any 3d graphs, I am proud to report that I have learned some helpful tricks over the years. I now try to:
- eliminate keys and apply my labels directly on the graph.
- use color sparingly and as a tool to highlight key data.
- apply a hierarchy to the data (i.e. make the summary data larger to draw the viewers’ attention).
- add some explanatory text to increase meaning.
I look forward to learning ways to continue to approve upon my designs!”

Deven Wisner
Deven shared his graduate school thesis slides…
Then
“In graduate school, I was quickly inspired by charts and reports that demonstrated best practices in data visualization.
It didn’t take me long to realize that presentations are visuals too… and that many of the same principles could be applied.
Even with this new-found wisdom, it took me awhile to find my groove with presentations — often overthinking them and struggling to apply best practices.
I’m sharing my thesis presentation, which at the time, seemed like an exception to the rules I’d only recently been empowered by. Specifically, I was in a constant state of conflict about sharing one concept at a time and imagery (okay, and other things…but only a couple things at a time!).”

Now
“Today, imagery is a tool I leverage for association — but only when it works (I put all visual aids through my relevance test, which I’ll be sharing in a blog post). The simple version? Your images should add a clear value to your audience! And if one isn’t appropriate, be comfortable with minimal text and truly discussing whatever it is you’re sharing.”

The Takeaway
We all start somewhere with our dataviz skills.
So, just start. And then keep going.
Leave a Reply