• Online Courses
  • Private Training
    • Full-Day Workshops
    • Conference Keynotes
  • Blog
  • Shop
    • Shirts & Hoodies
    • Ebooks
    • Chart Templates
  • About
  • Contact
Depict Data Studio
Depict Data Studio
  • Online Courses
  • Private Training
    • Full-Day Workshops
    • Conference Keynotes
  • Blog
  • Shop
    • Shirts & Hoodies
    • Ebooks
    • Chart Templates
  • About
  • Contact
  • Online Courses
  • Private Training
    • Full-Day Workshops
    • Conference Keynotes
  • Blog
  • Shop
    • Shirts & Hoodies
    • Ebooks
    • Chart Templates
  • About
  • Contact

Stacked Area

Display part-to-whole patterns over time.

Description

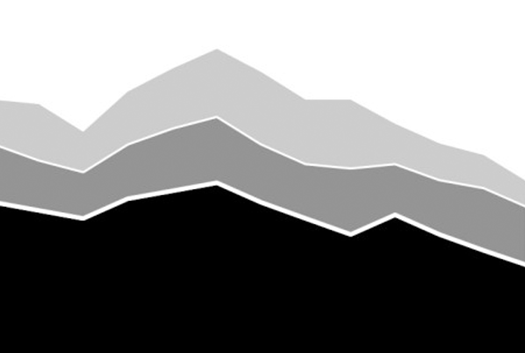
Stacked area charts display part-to-whole patterns over time.

Functions

Examples

  • A growing health crisis: The projected number of people living with dementia
  • Distribution of income by number of income earners
  • Carbon dioxide continues to reach new highs
  • People attending two-year and four-year colleges have steadily risen
  • A record 170,000 migrants entered Italy via the Mediterranean Sea last year
  • Religious composition of the United States, 2010 vs. 2015
  • Number of illegal immigrants in the United States, Mexican vs. other groups, 1995 through 2012

Example Chart
More Charts

Ann K. Emery shows 3 ways to fix dense graphs: graying everything out, small multiples, or interactivity/animation.

3 Ways to Fix Dense Graphs

Ann K. Emery shares 40 tips in 40 days to celebrate Excel's 40th birthday. HBDXL

Happy Birthday, Excel!

Fewer Colors & Report Templates by Emma Williams

Depict Data Studio
  • Dataviz Courses
  • Private Training
  • Blog
  • Swag
  • About
  • Contact
Copyright © 2025 Depict Data Studio | All Rights Reserved | Web Design by Kicks Digital Marketing