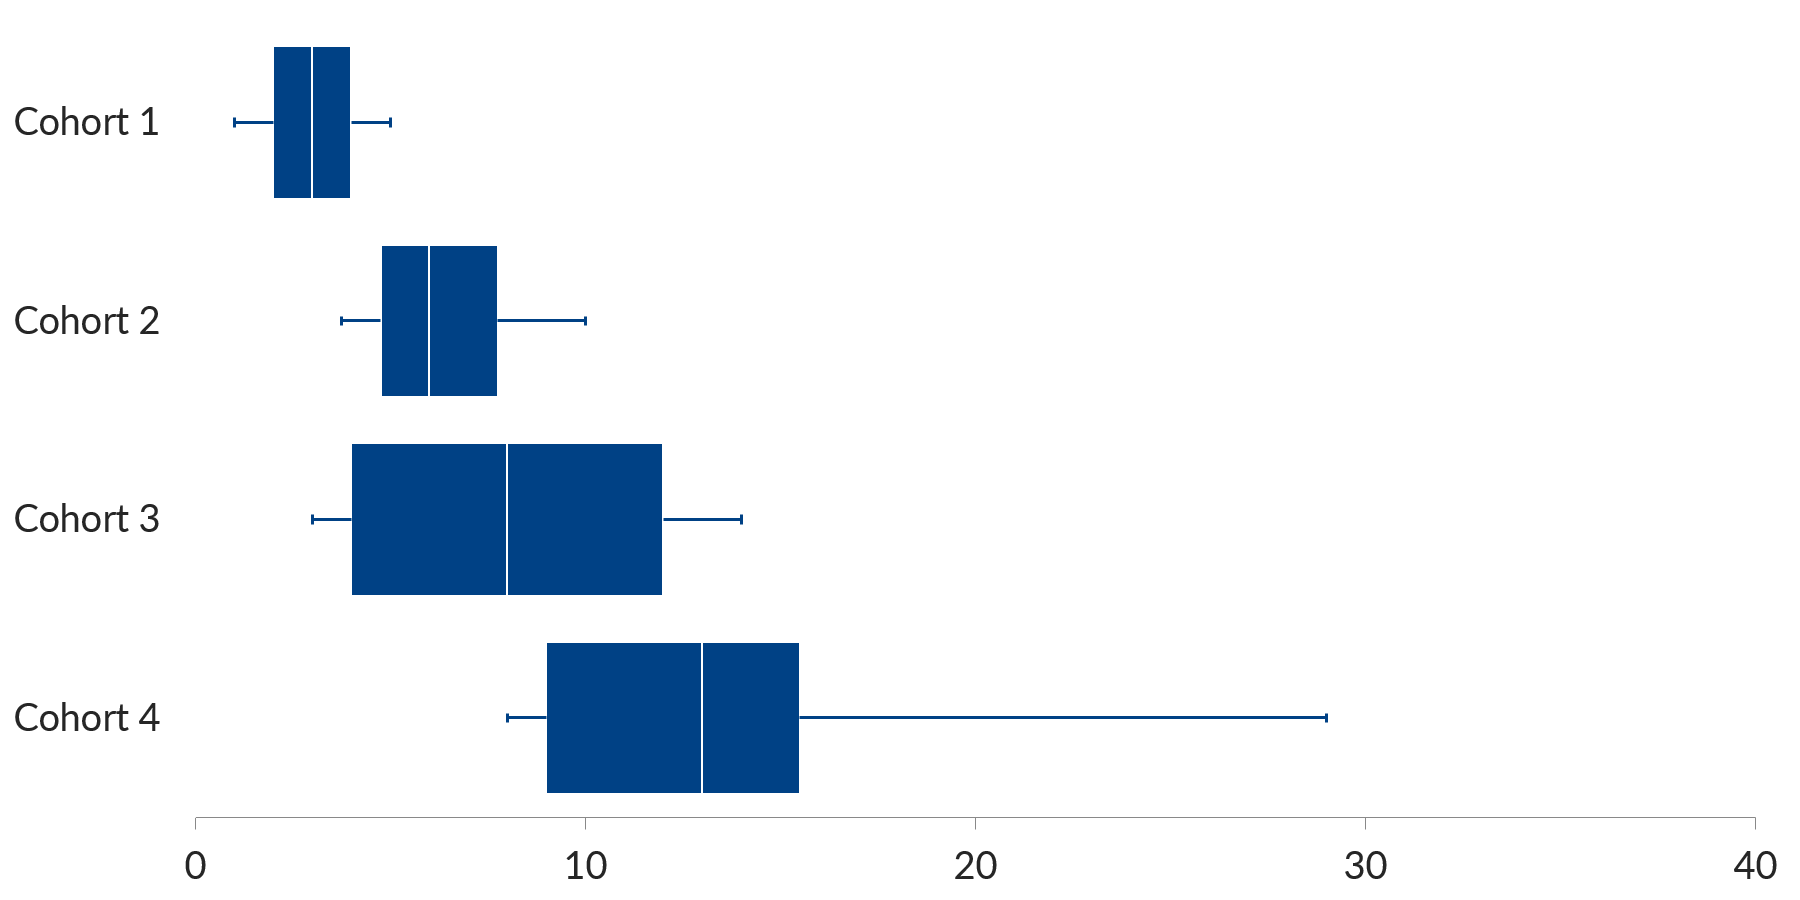
Common in high school statistics courses, but not so common in the real world. These graphs display the min, max, mean or median, and quartiles 1 and 3.
Tutorials
Common in high school statistics courses, but not so common in the real world. These graphs display the min, max, mean or median, and quartiles 1 and 3.
Tutorials