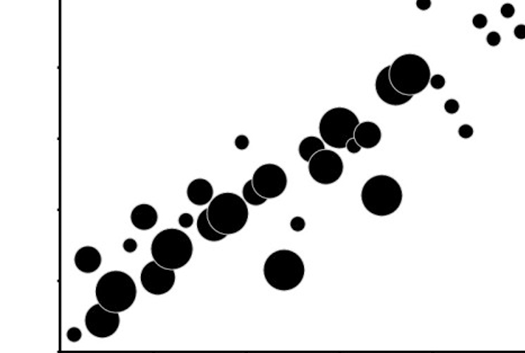
Bubble charts display correlations between three variables, x, y, and z. They’re an extension of the scatter plot, which displays correlations between just two variables.
x = first variable, shown on the x-axis
y = second variable, shown on the y-axis
z = third variable, represented by the bubble’s size or area