Online Courses
Private Training
Full-Day Workshops
Conference Keynotes
Blog
Shop
Shirts & Hoodies
Ebooks
Chart Templates
About
Contact
Online Courses
Private Training
Full-Day Workshops
Conference Keynotes
Blog
Shop
Shirts & Hoodies
Ebooks
Chart Templates
About
Contact
Online Courses
Private Training
Full-Day Workshops
Conference Keynotes
Blog
Shop
Shirts & Hoodies
Ebooks
Chart Templates
About
Contact
Calendars
Visualize key milestones.
Description
Visualize key milestones that took place over the past month(s).
Functions
Examples
This shutdown is already one of the longest ever
The extinction of the daily Press Secretary briefing
Increased search activity broadens over time in scope and geography
What Congress has accomplished since the Sandy Hook massacre
Timeline of court decisions about lethal injections
Example Chart
More Charts
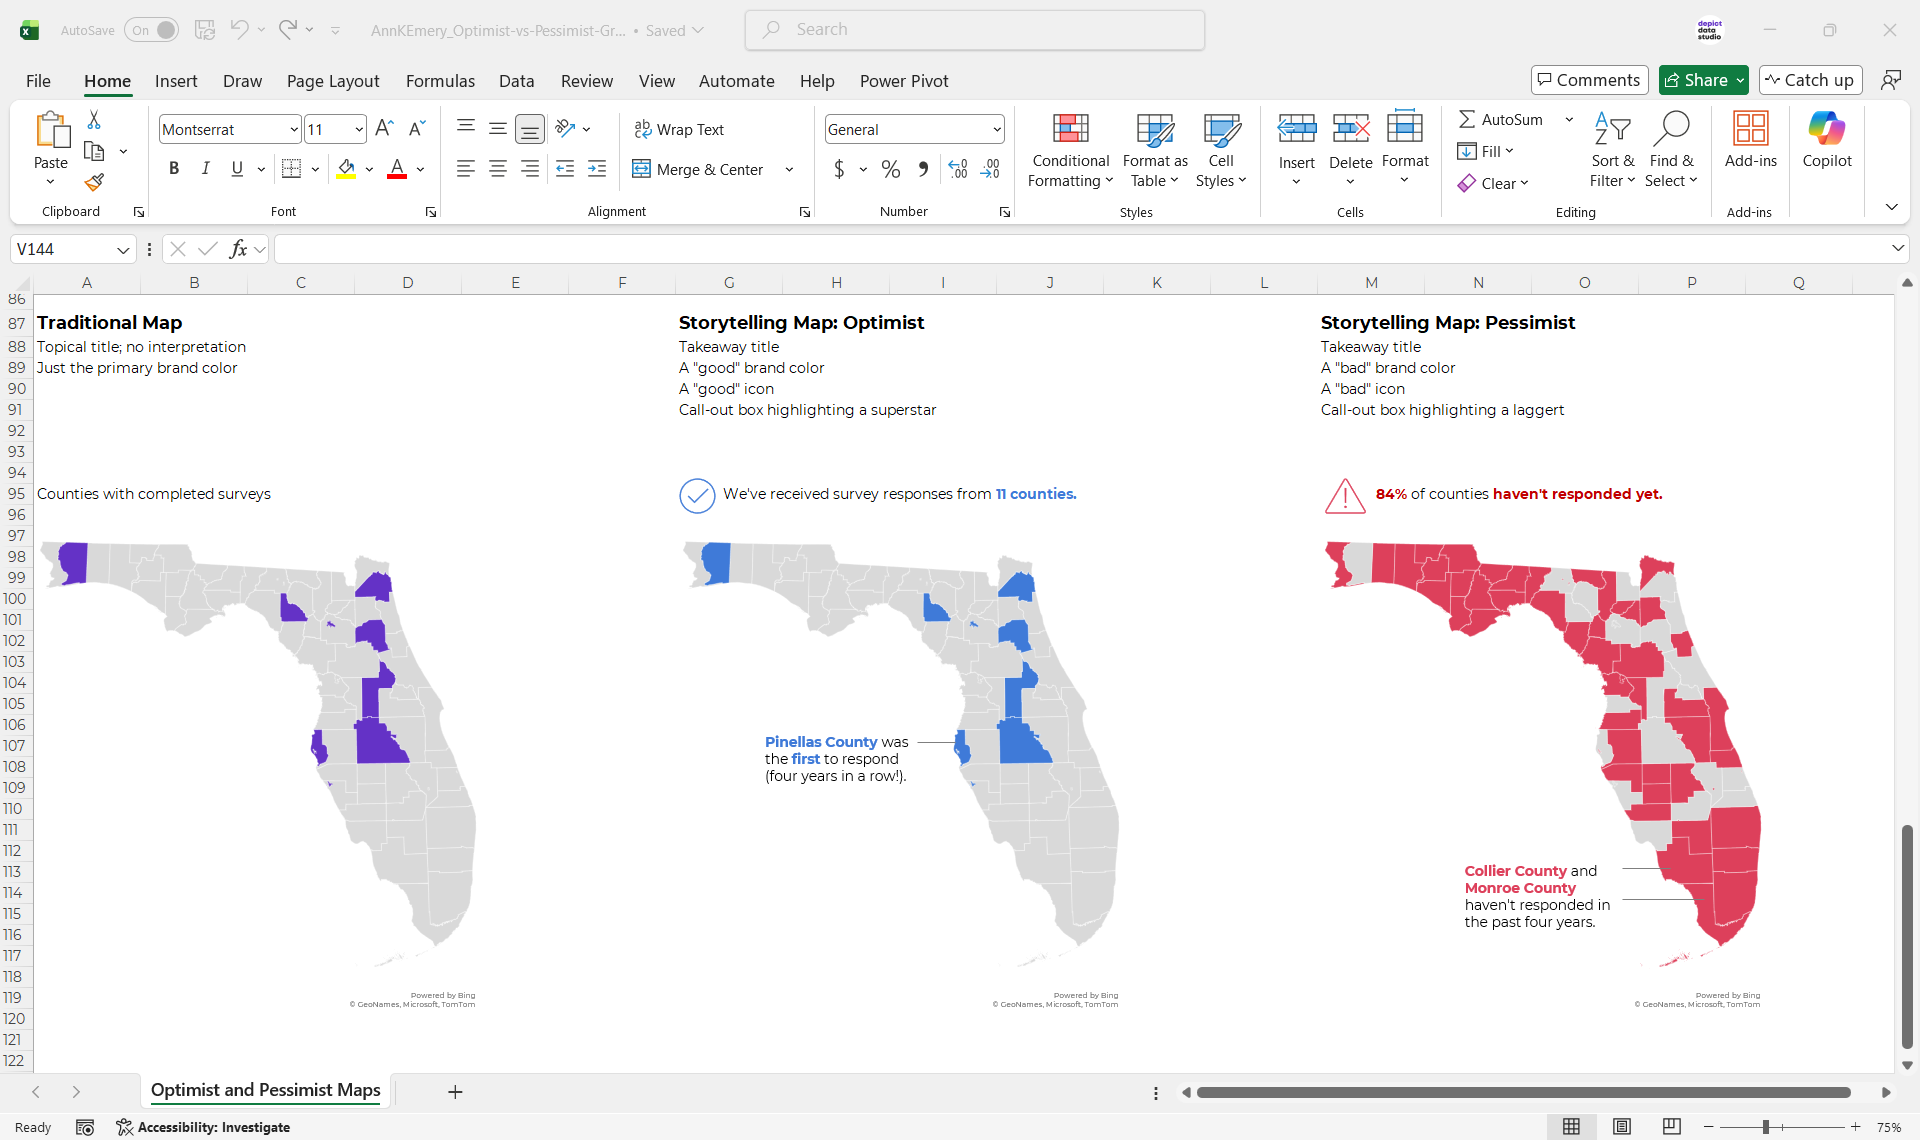
Optimist vs. Pessimist Maps
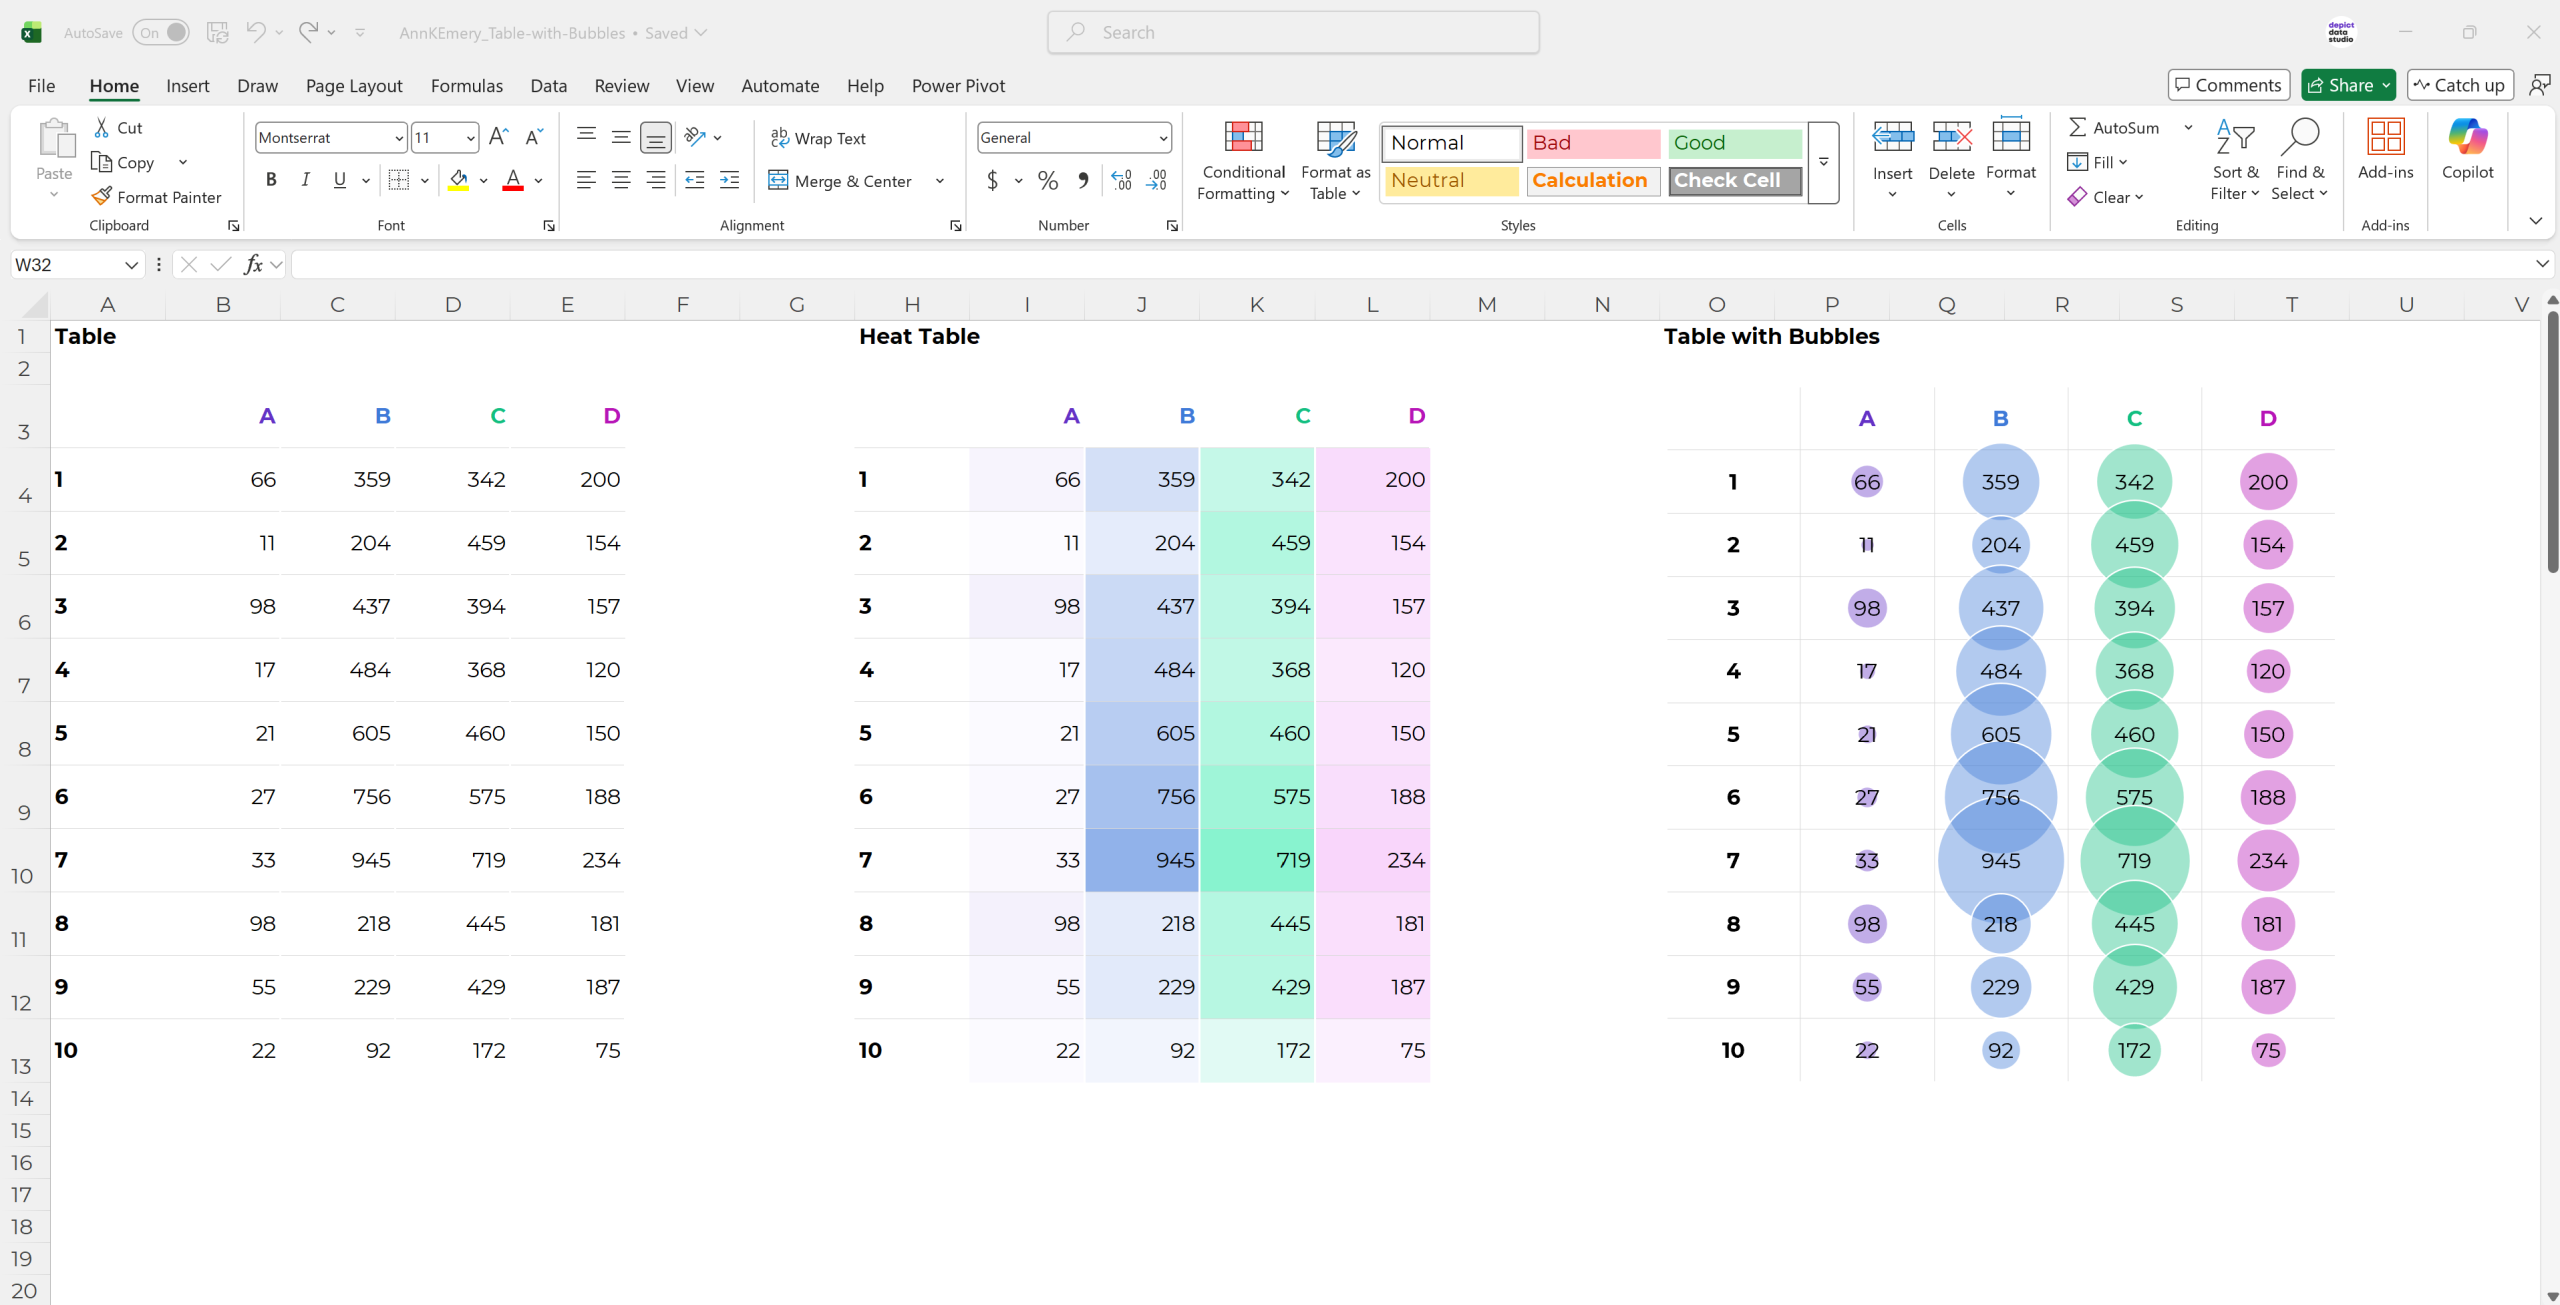
Tables with Bubbles
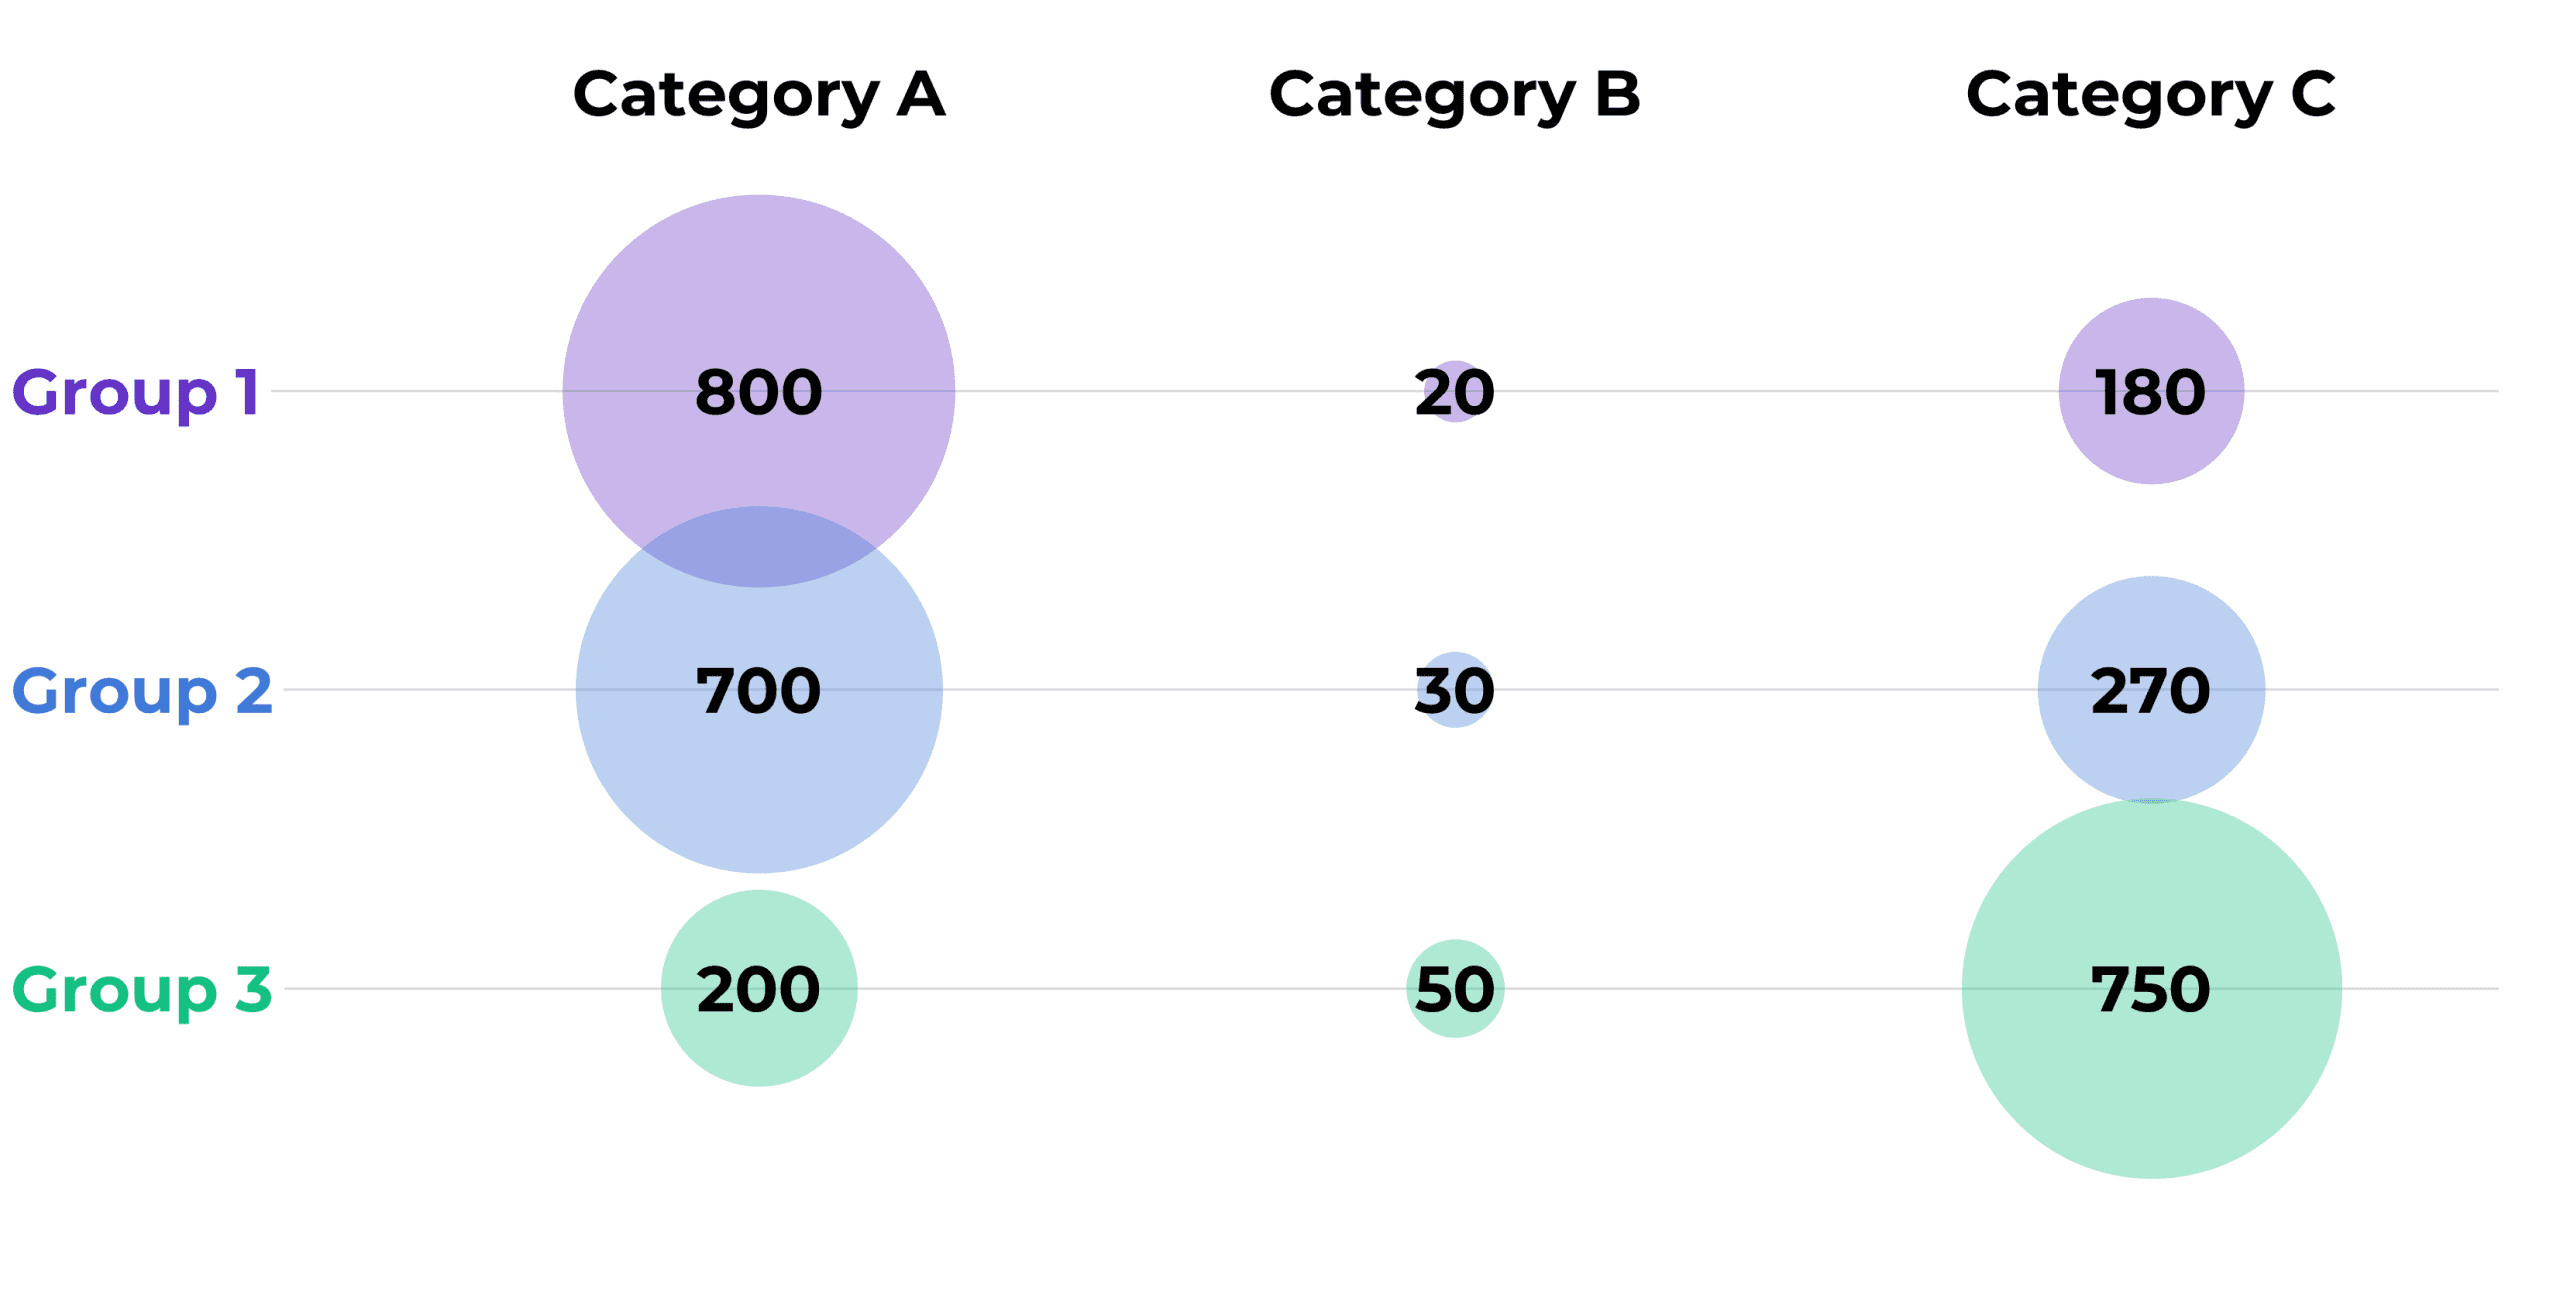
Bubble Charts (An Alternative to Bars)