We can all agree that 3D exploding pie charts are pretty rotten. My vote for worst chart? The clustered bar chart. I see clustered bar charts everywhere. E-V-E-R-Y-W-H-E-R-E. On pages 1, 2, 3, 4, 5, 6, 7, 8, 9, and 10 of reports. In slides 1, 2, 3, 4, 5, 6, 7, 8, 9, and 10 of presentations. In every handout, dashboard, and infographic.
Clustered bar charts aren’t inherently bad, but their overuse is killing me. What’s worse than a text-heavy report with zero graphics? A report that only contains the same chart type over and over and over, regardless of whether that chart is really the best tool for the job.
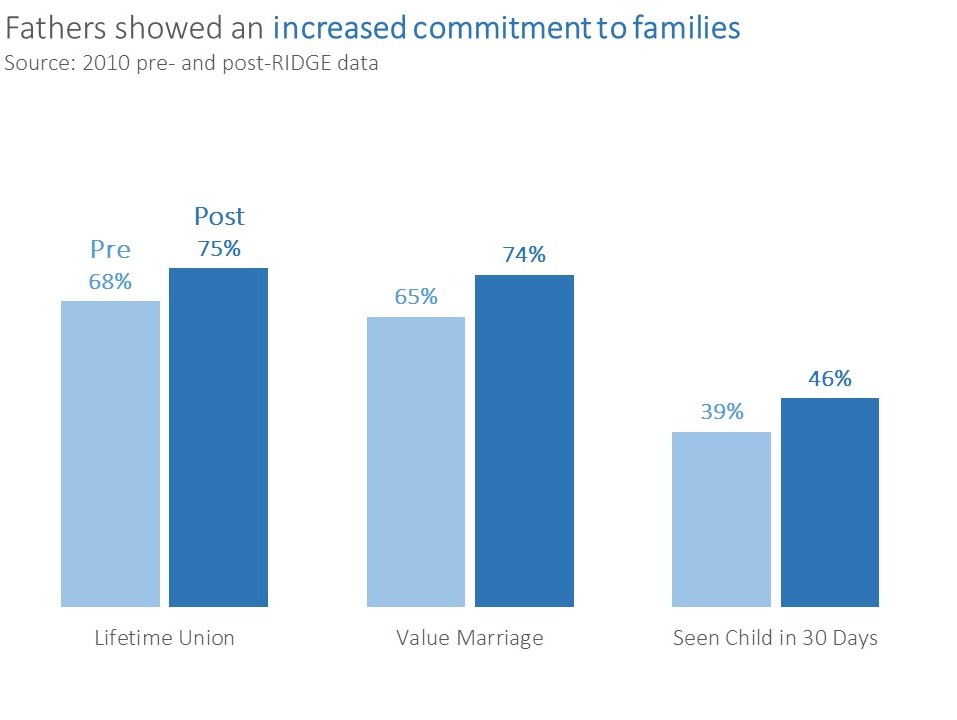
Synonyms
- Paired bar chart
- Side-by-side bar chart
Resources