• Dataviz Courses
    • Dashboard Design
    • Soar Beyond the Dusty Shelf Report
    • More Courses
  • Private Training
    • Workshops
    • Keynotes
  • Blog
  • Shop
    • Ebooks
    • Chart Templates
    • Shirts & Hoodies
  • About
  • Contact
Depict Data Studio
Depict Data Studio
  • Dataviz Courses
    • Dashboard Design
    • Soar Beyond the Dusty Shelf Report
    • More Courses
  • Private Training
    • Workshops
    • Keynotes
  • Blog
  • Shop
    • Ebooks
    • Chart Templates
    • Shirts & Hoodies
  • About
  • Contact
  • Dataviz Courses
    • Dashboard Design
    • Soar Beyond the Dusty Shelf Report
    • More Courses
  • Private Training
    • Workshops
    • Keynotes
  • Blog
  • Shop
    • Ebooks
    • Chart Templates
    • Shirts & Hoodies
  • About
  • Contact

Deviation Graph

Display the differences between two things.

Description

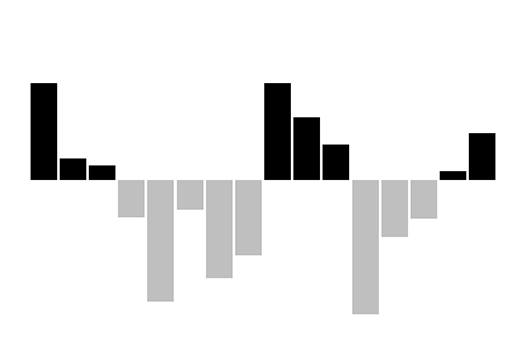
In a deviation graph, you just display the differences between two things (rather than a traditional bar or column in which you graph the frequency or average).

Functions

Examples

  • The fastest-growing US counties and metropolitan areas
  • Naturalization rates up among most immigrant groups in the U.S. since 2005
  • Coffee break: Industry’s compound annual growth rate
  • Who actually benefits from the proposed tax plan
  • Year-over-year change in S&P 500 earnings

Example Chart

More Charts

Entrepreneurial Insights for Expecting Mothers on Heather Sager’s “Hint of Hustle” Podcast

Redesigning a Thesis Chapter

How to Make Interactive Dashboards in Excel

Depict Data Studio
  • Dataviz Courses
  • Private Training
  • Blog
  • Swag
  • About
  • Contact
Copyright © 2023 Depict Data Studio | All Rights Reserved | Web Design by Kicks Digital Marketing