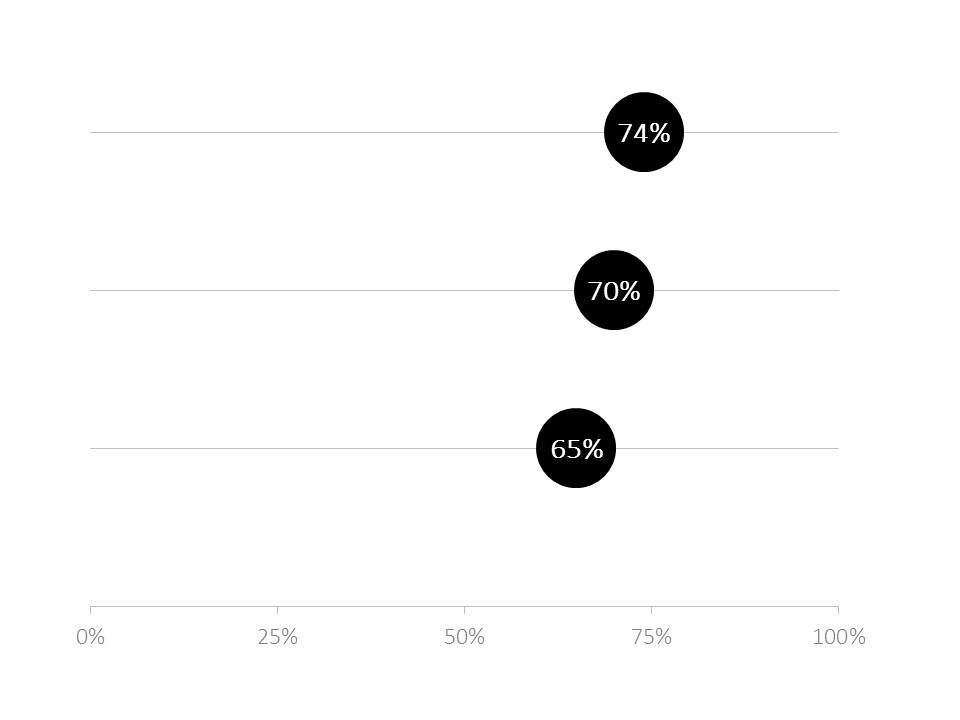
Dot plots are similar to bar charts. Imagine a bar chart. Where do your eyes go? Our eyes are naturally drawn to the ends of the bars. Our brains are comparing the lengths of each category. A dot plot takes advantage of that brain function by placing a circle or dot at the end of each bar. When you peel away the bar, you’re left with a dot plot.
Synonyms
- Lollipop
Resources