Online Courses
Private Training
Full-Day Workshops
Conference Keynotes
Blog
Shop
Shirts & Hoodies
Ebooks
Chart Templates
About
Contact
Online Courses
Private Training
Full-Day Workshops
Conference Keynotes
Blog
Shop
Shirts & Hoodies
Ebooks
Chart Templates
About
Contact
Online Courses
Private Training
Full-Day Workshops
Conference Keynotes
Blog
Shop
Shirts & Hoodies
Ebooks
Chart Templates
About
Contact
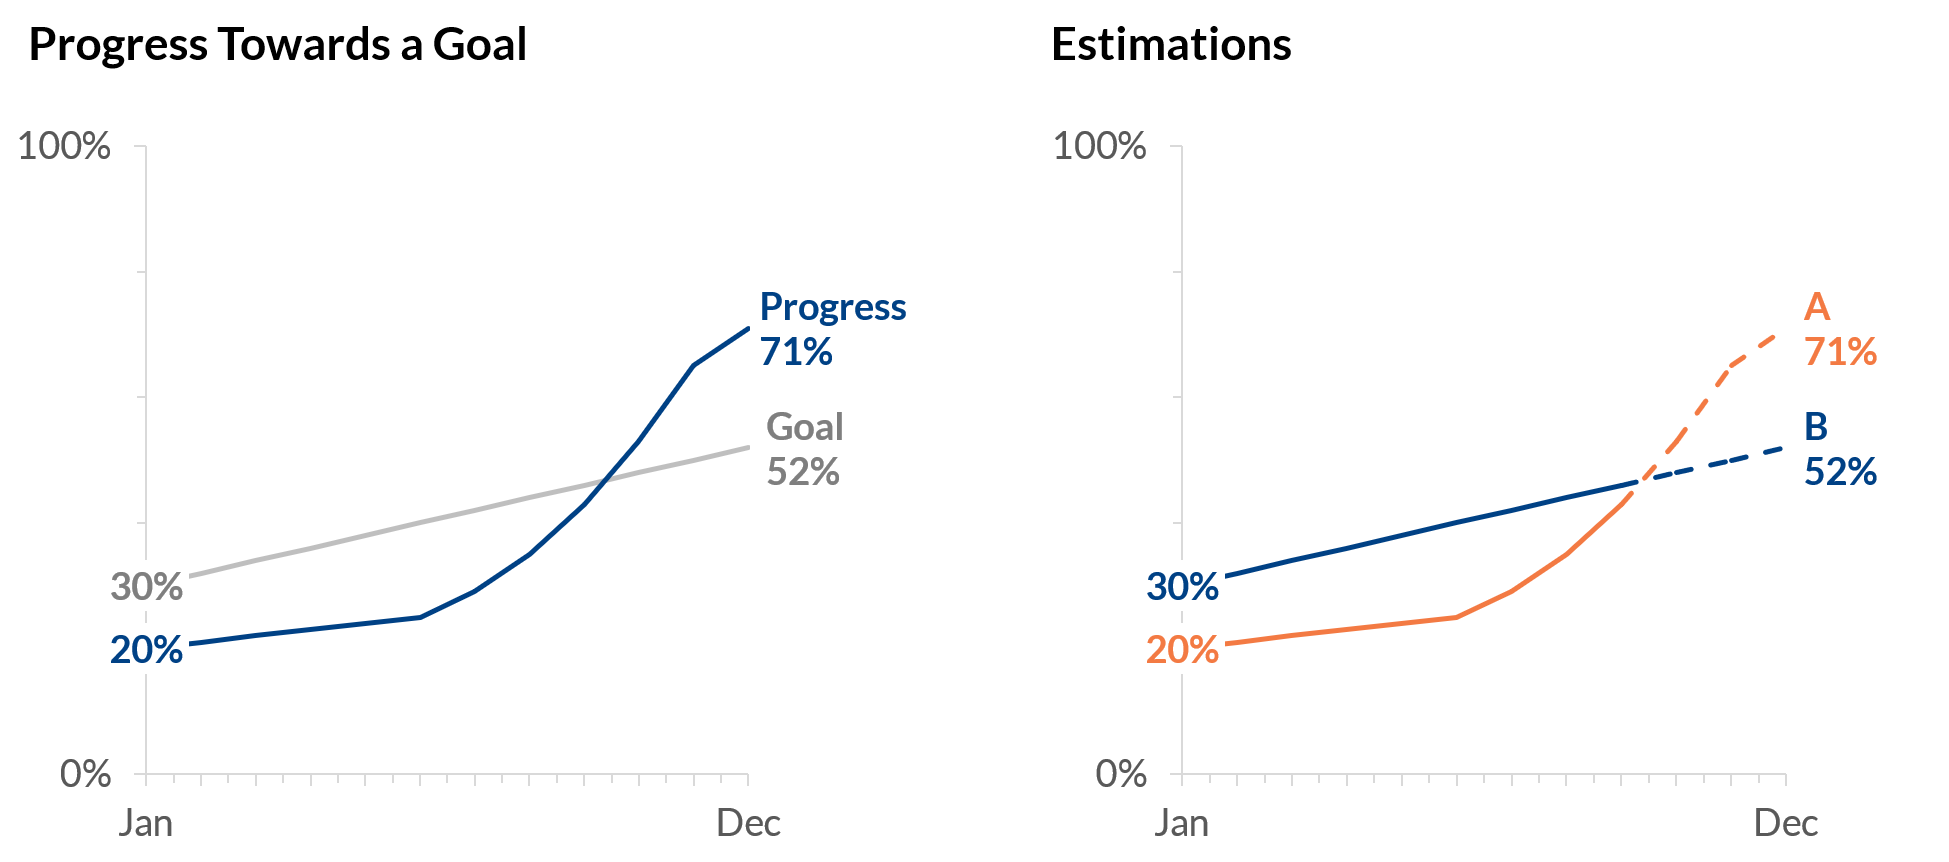
Estimations
Visualize estimations or projections with dotted lines.
Description
Visualize estimations or projections with dotted lines.
Functions
Examples
Global temperature change
Example Chart
More Charts
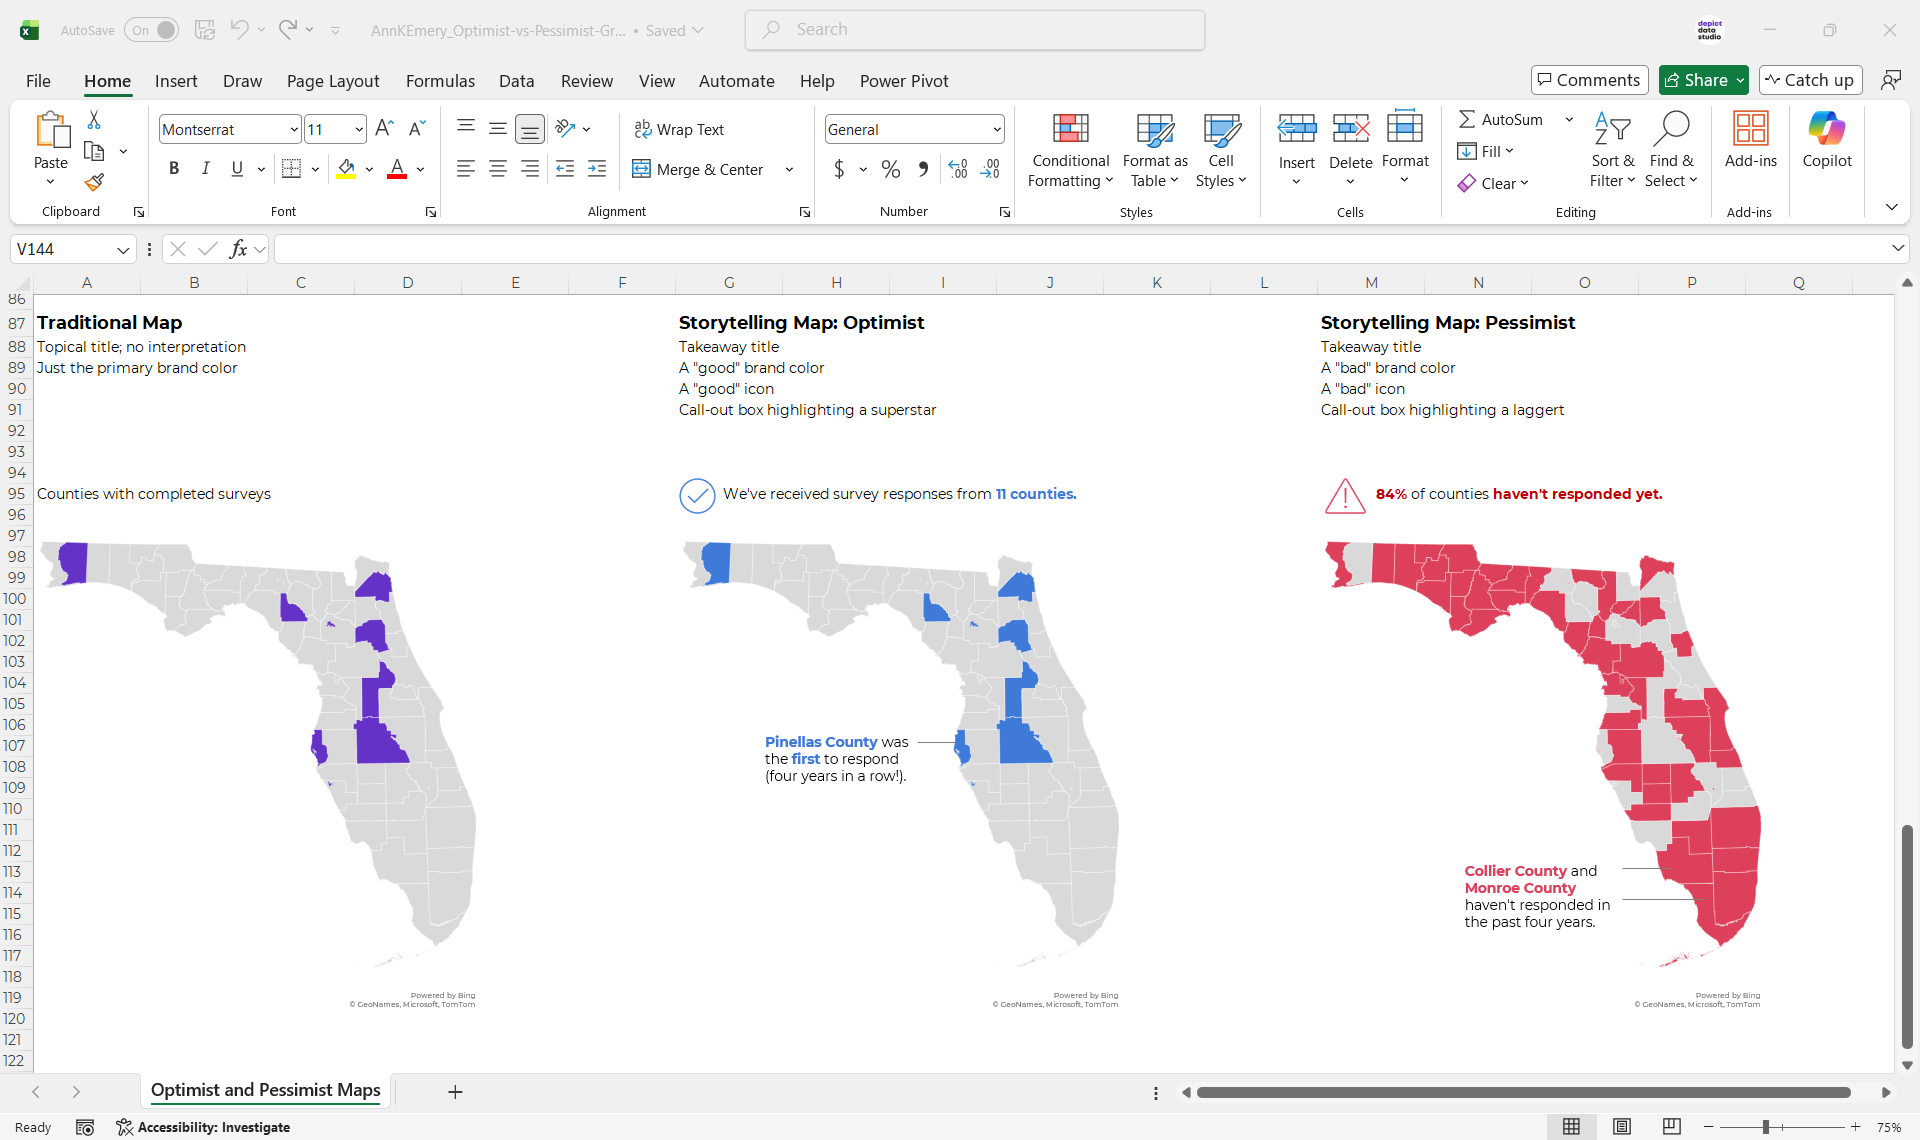
Optimist vs. Pessimist Maps
Tables with Bubbles
Bubble Charts (An Alternative to Bars)