Online Courses
Private Training
Full-Day Workshops
Conference Keynotes
Blog
Shop
Shirts & Hoodies
Ebooks
Chart Templates
About
Contact
Online Courses
Private Training
Full-Day Workshops
Conference Keynotes
Blog
Shop
Shirts & Hoodies
Ebooks
Chart Templates
About
Contact
Online Courses
Private Training
Full-Day Workshops
Conference Keynotes
Blog
Shop
Shirts & Hoodies
Ebooks
Chart Templates
About
Contact
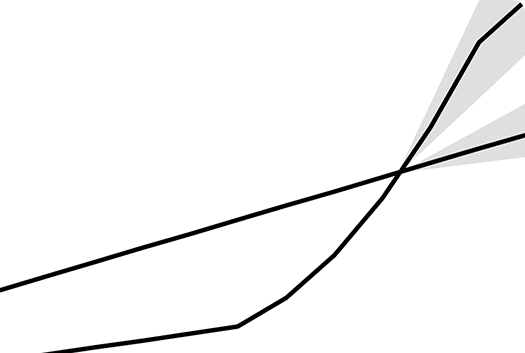
Fan Chart
Apply light shading above and below your line to indicate margins of error.
Description
You can shade +/- a standard deviation, a confidence interval, and more.
Functions
Examples
Unauthorized immigrant population trends
Communicating quality, uncertainty, and change
Who’s ahead in the mid-term race
Rosier outlook
The myth of the 2017 “youthquake” election
Estimated natural interest rate after inflation
Example Chart
More Charts
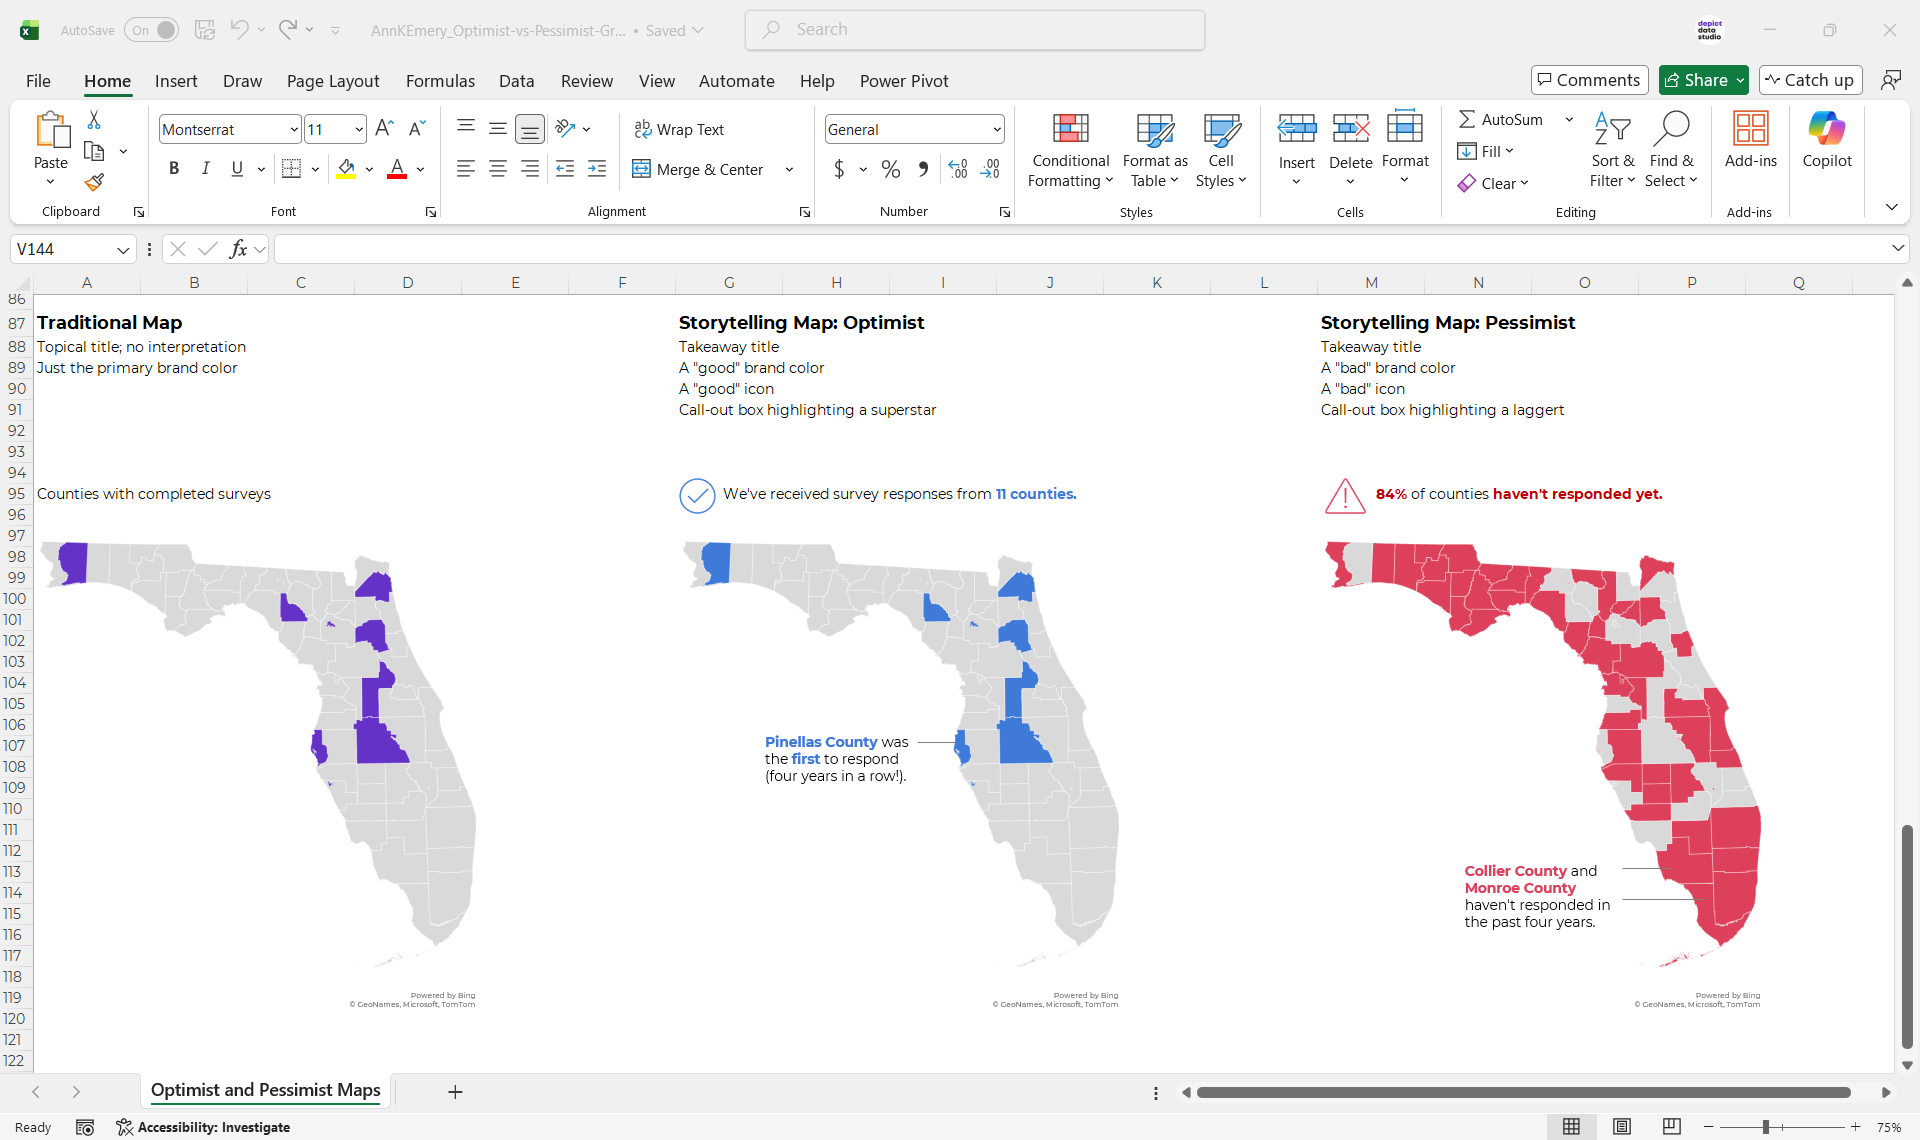
Optimist vs. Pessimist Maps
Tables with Bubbles
Bubble Charts (An Alternative to Bars)