Online Courses
Private Training
Full-Day Workshops
Conference Keynotes
Blog
Shop
Shirts & Hoodies
Ebooks
Chart Templates
About
Contact
Online Courses
Private Training
Full-Day Workshops
Conference Keynotes
Blog
Shop
Shirts & Hoodies
Ebooks
Chart Templates
About
Contact
Online Courses
Private Training
Full-Day Workshops
Conference Keynotes
Blog
Shop
Shirts & Hoodies
Ebooks
Chart Templates
About
Contact
Icon Array
Each icon represents one unit of something.
Description
Each icon represents one unit of something, e.g., one person.
Synonyms
Unit
Pictograph
Isotype
Resources
Isotype Visualization: Working Memory, Performance, and Engagement
Functions
Examples
One-fifth of Americans say they attended a political rally in the past two years
If the world was 100 people…
America’s most congested cities
Key races: House and Senate
These six non-states’ population is roughly the same as that of the six least-populous states
Hearing from those we seek to help: Nonprofit practices and perspectives in beneficiary feedback
Fired/Rehired
If the U.S. had 100 people: Charting Americans’ religious affiliations
Number of white men in the first cabinet of each president
Number of Syrian teens who have been to the hospital in the past year
Religious affiliations of House and Senate members
Americans who rely on smartphones for internet access
Number of female Senators
Presidential pardons
Wealthy donors’ giving patterns to universities
Number of female Board members
Example Chart
More Charts
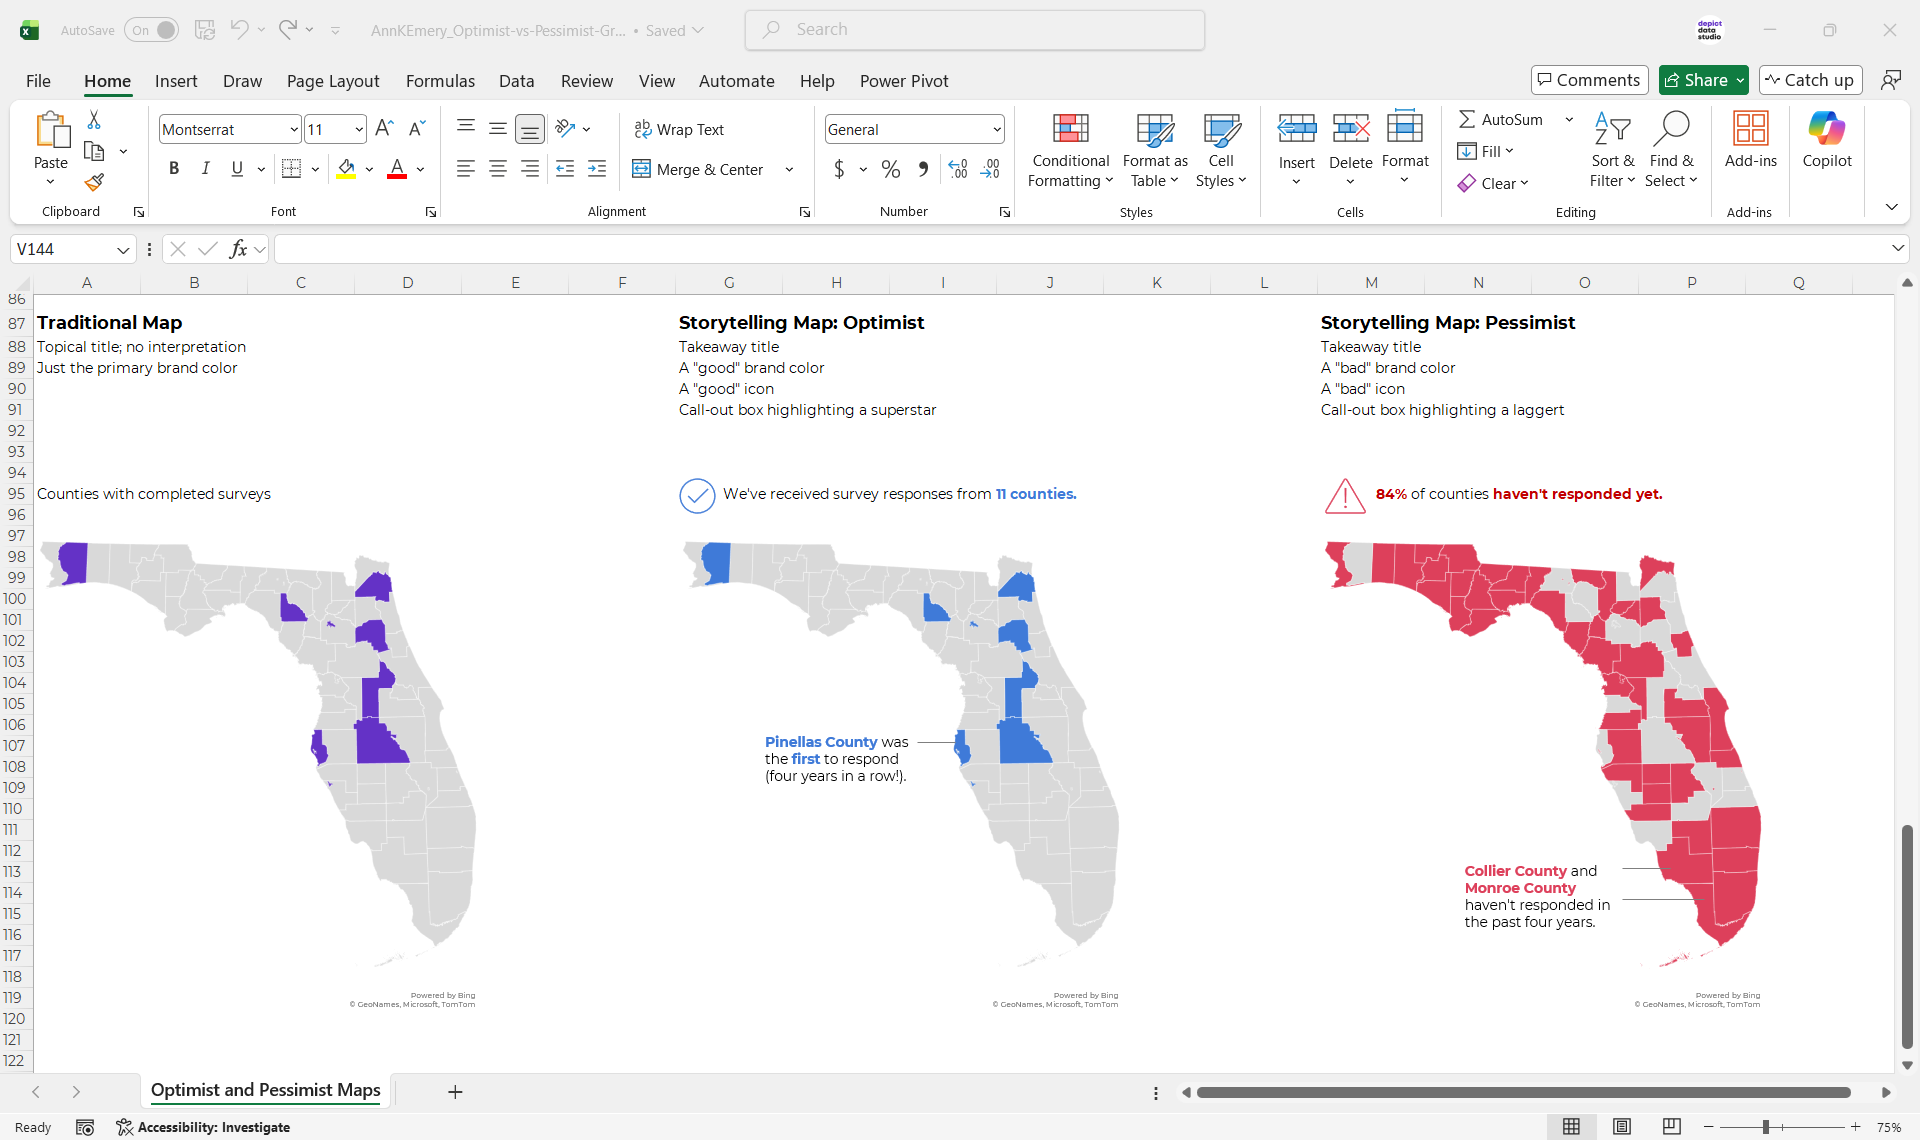
Optimist vs. Pessimist Maps
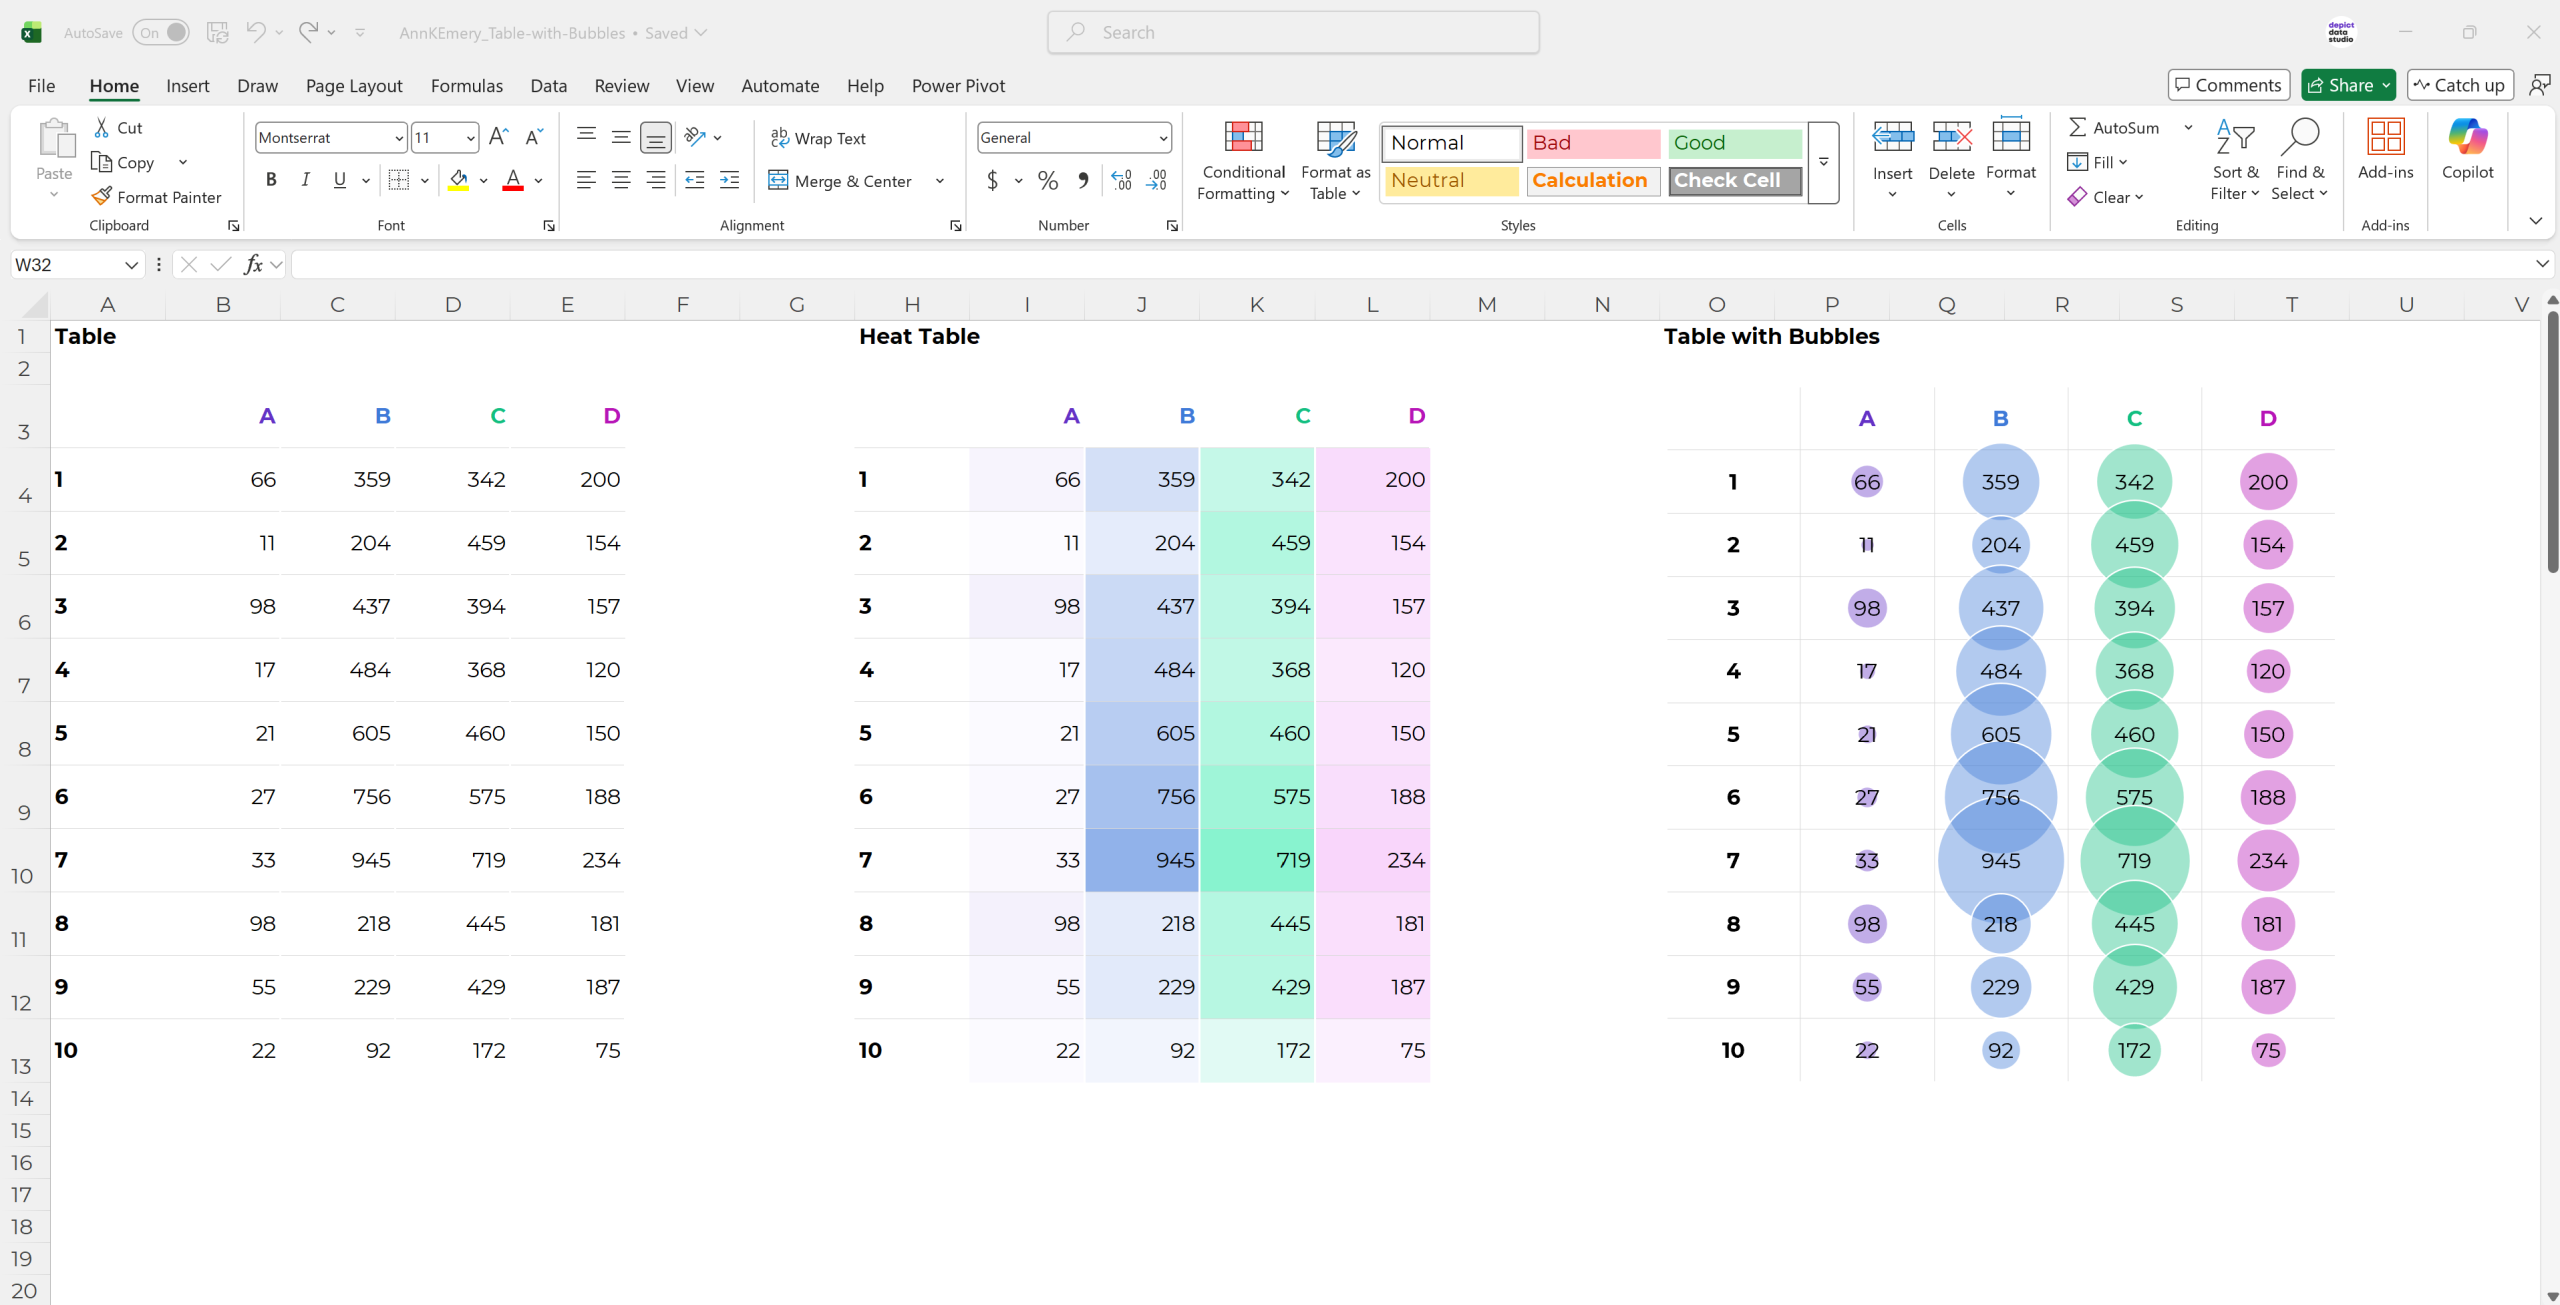
Tables with Bubbles
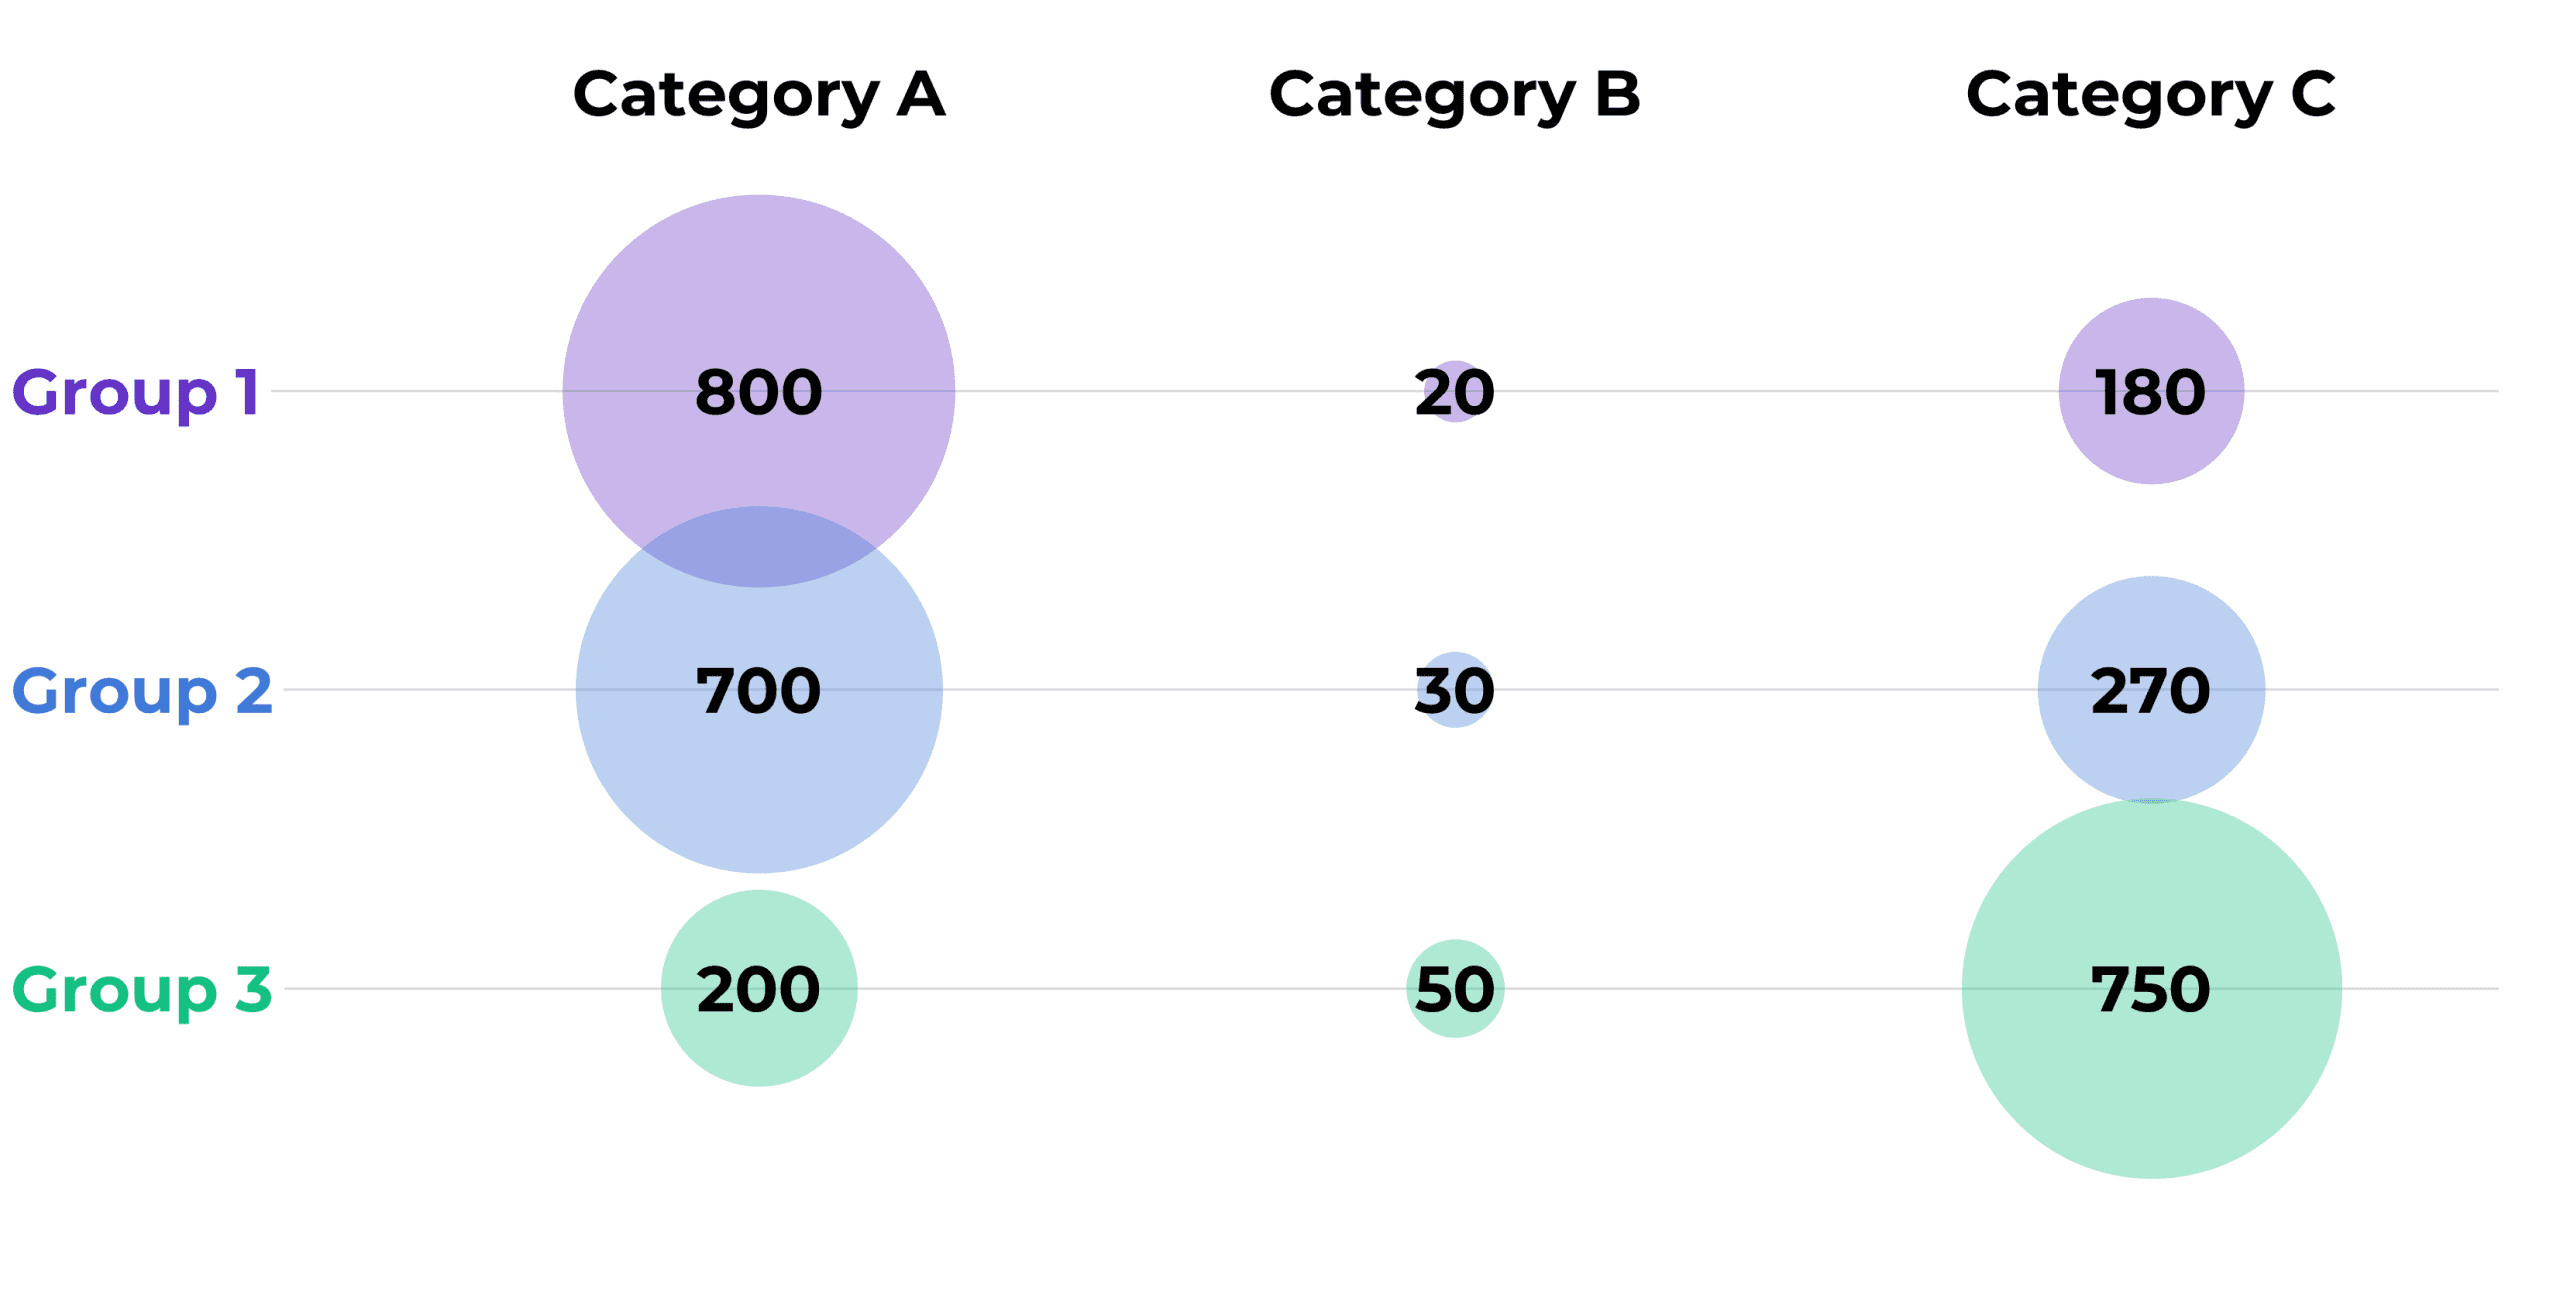
Bubble Charts (An Alternative to Bars)