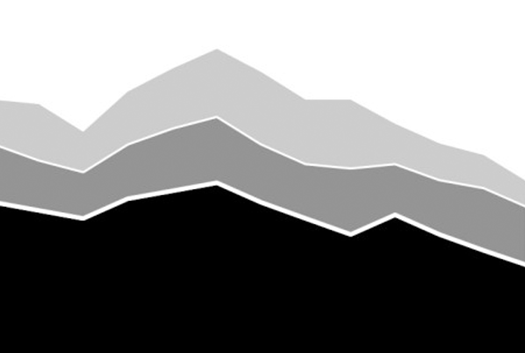
Stacked area charts display part-to-whole patterns over time.
Stacked Area
Display part-to-whole patterns over time.
Description
Functions
Examples
- A growing health crisis: The projected number of people living with dementia
- Distribution of income by number of income earners
- Carbon dioxide continues to reach new highs
- People attending two-year and four-year colleges have steadily risen
- A record 170,000 migrants entered Italy via the Mediterranean Sea last year
- Religious composition of the United States, 2010 vs. 2015
- Number of illegal immigrants in the United States, Mexican vs. other groups, 1995 through 2012
Example Chart


