A quick demo for my kindergartener.
“Higher is Better” vs. “Lower is Better” Clarifications on Graphs
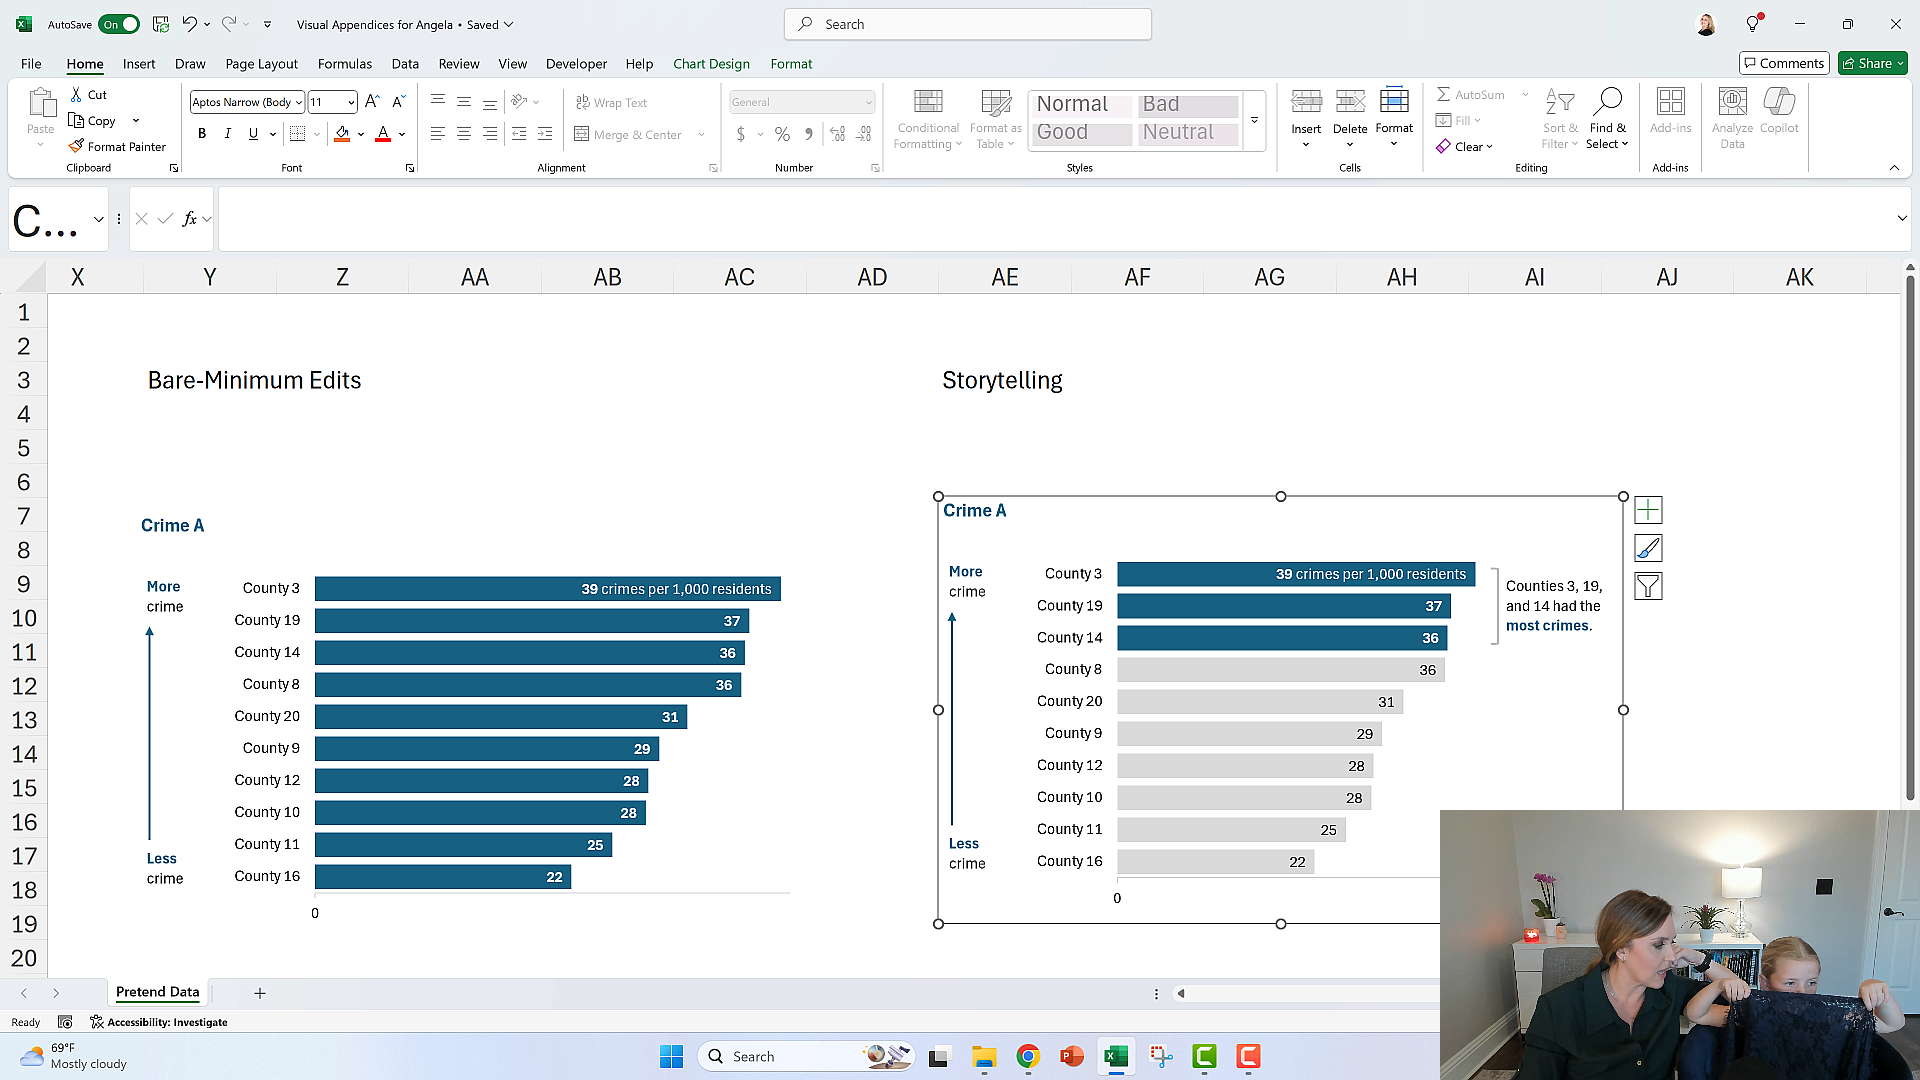
Sometimes, higher numbers are better. And other times, lower numbers are better. Here’s how you can add icons and text boxes to graphs to remove that guesswork for your colleagues.
Leave a Reply