Leave a Reply

Your email address will not be published. Required fields are marked *

How to Make Interactive Dashboards in Excel: Colonoscopy Screening Example

Updated on: Feb 19th, 2025
Dashboards
, , , , , , , ,
Thumbnail

My 3rd grader was not impressed. ;P
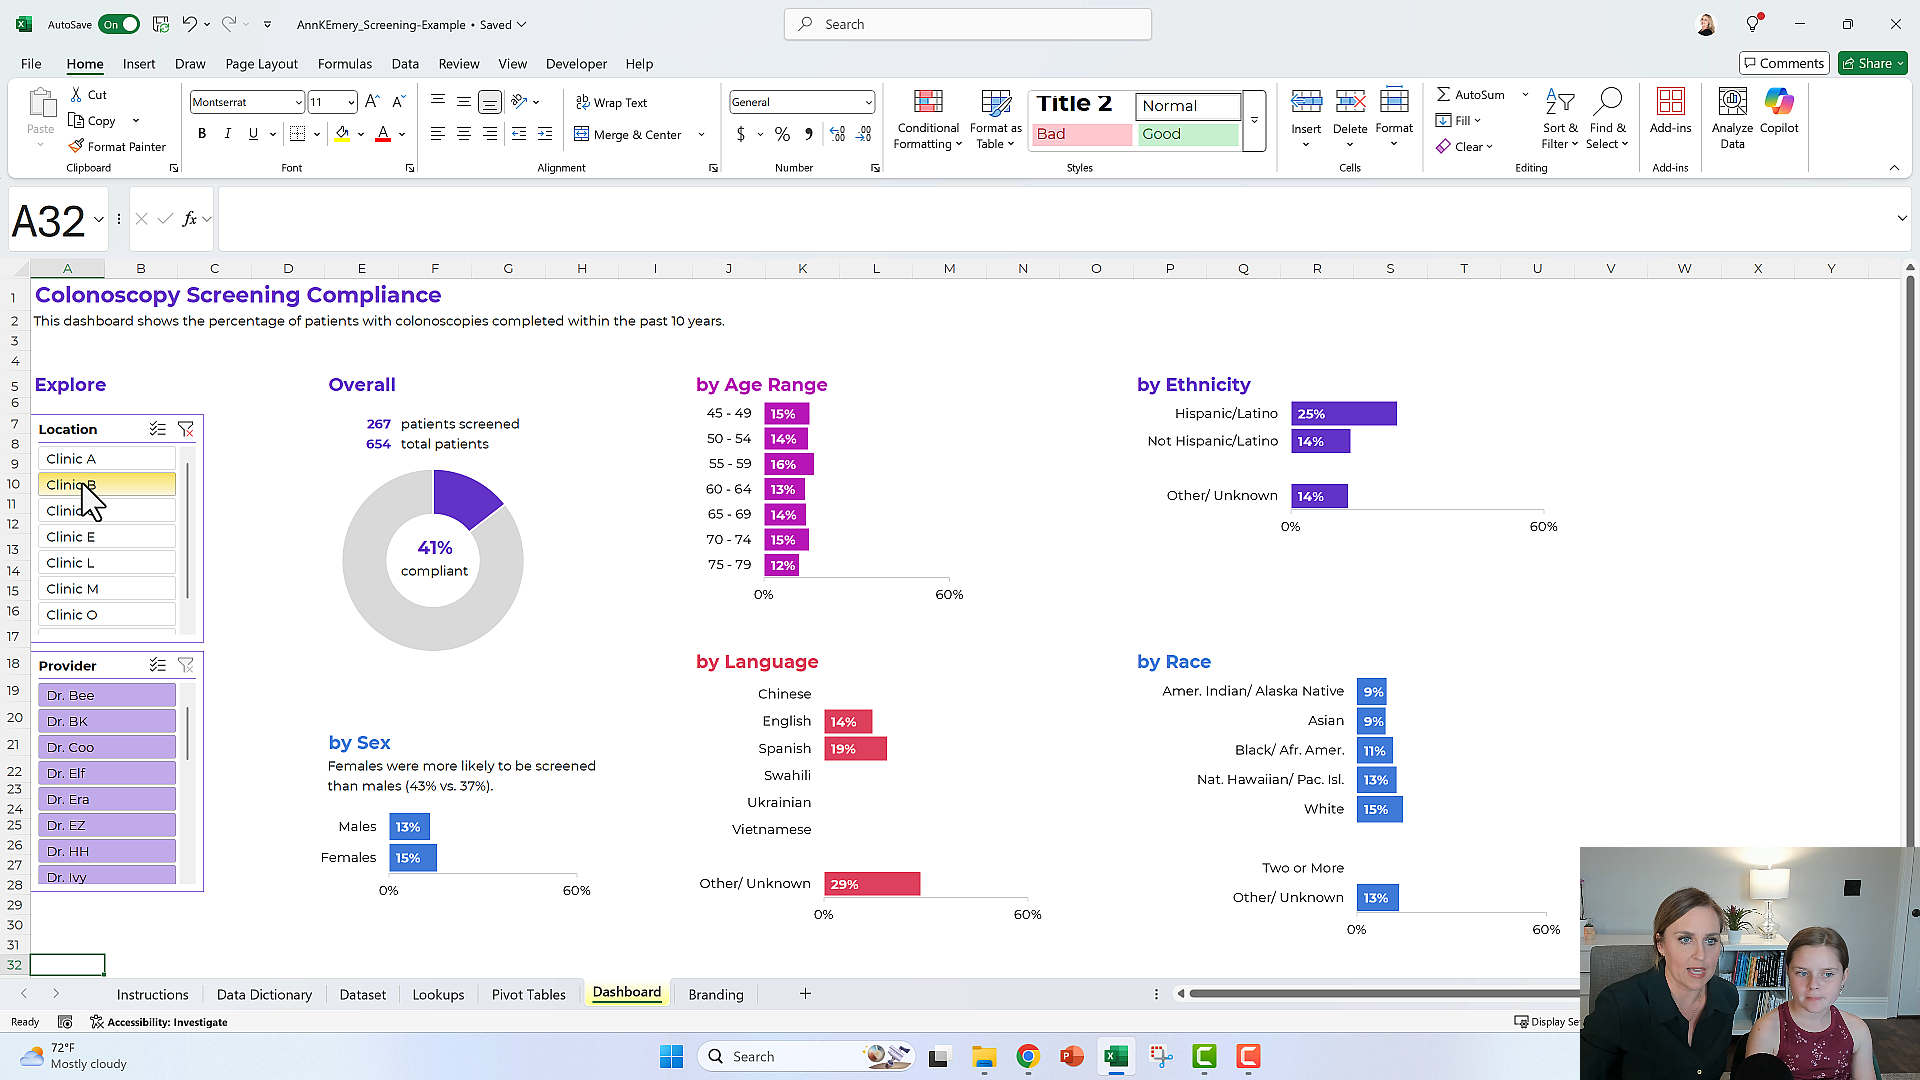
What’s Inside

More about Ann K. Emery
Ann K. Emery is a sought-after speaker who is determined to get your data out of spreadsheets and into stakeholders’ hands. Each year, she leads more than 100 workshops, webinars, and keynotes for thousands of people around the globe. Her design consultancy also overhauls graphs, publications, and slideshows with the goal of making technical information easier to understand for non-technical audiences.

Leave a Reply

Your email address will not be published. Required fields are marked *

You Might Like

Our complimentary mini course for beginners to dataviz. Takes 45 minutes to complete.

Enroll

20 Stress-Free Charts for Dashboards (That You Can Make in Spreadsheet Programs like Excel)

You’ll learn about 20 stress-free charts that we can make inside spreadsheet software like Microsoft Excel. These visuals can be added to static or interactive dashboards. They’re fast for us to make… which means a quick turnaround time for your audiences. No need to wait weeks or months until a dashboard is ready! These visuals are made within minutes, so your dashboard is ready same-day.

More »

Want to wow your boss with a dynamic dashboard? Or, how about a one-pager of key findings? Our 4-course bundle provides all the how-to’s.

Enroll

Subscribe

Not another fluffy newsletter. Get actionable tips, videos and strategies from Ann in your inbox.