
I’ve been in love with diverging stacked bar charts since I saw Joe Mako’s submission to Cole Nussbaumer’s dataviz challenge last December. Joe made this contest-winning chart. But in Tableau! The amazing but expensive software!
Could I ever create one in Excel?!
Yes! Luckily I’d learned about the Values in Reverse Order feature from Stephanie Evergreen. With Joe’s inspiration and Stephanie’s strategy, I started making these beauties for myself in Excel.
I wanted to share the chart secrets with all of you, so last month, I challenged readers to re-create a diverging stacked bar chart like this one: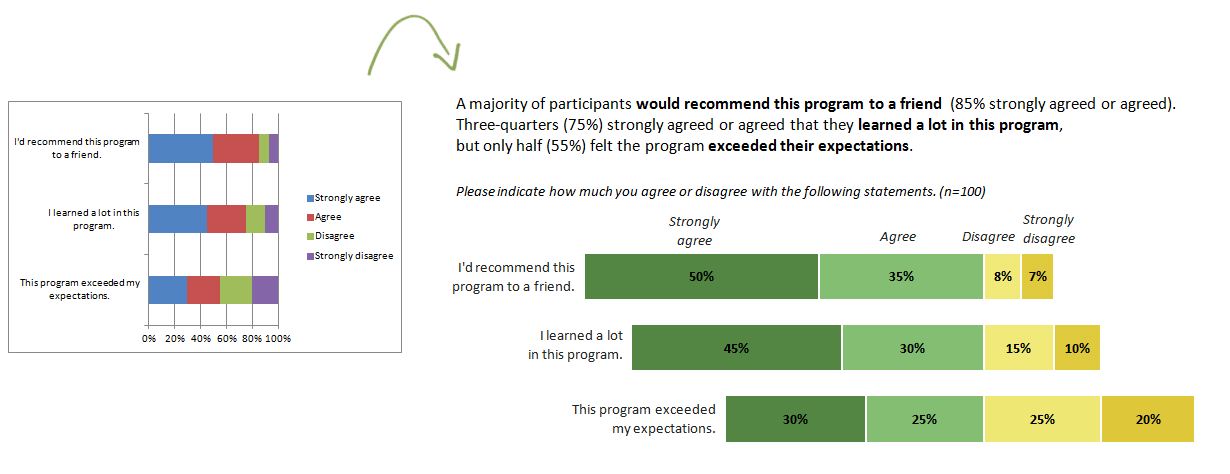
It looks like I’m not the only one who loves diverging stacked bar charts. Congratulations to the 12 contestants! In order of submission, they are:
- David Napoli
- Anjie Raber
- David Bonachea
- Sheila Robinson
- Amanda Drescher
- Kristin Minichello
- @luno1972
- Hornyik Jozsef (in d3! with code!)
- Stephanie Evergreen
- Angelina Lopez
- Kevin Gilds
- Praveen Gowda
Most contestants seized the opportunity to use their own datasets and made adjustments as needed. For example, Sheila’s dataset fit a traditional stacked bar chart better than a diverging stacked bar chart, and Anjie needed to display cut-off scores.
So how do you make these diverging stacked bar charts, anyways?! There are at least two strategies: Either a) create two separate charts, a strategy demonstrated in previous posts like this one, or b) use floating bars, a strategy demonstrated in previous posts like this one. Stephanie Evergreen blogged about strategy B a few weeks ago and her explanation is pretty awesome, so I’m going to focus on strategy A today.
Here’s a slideshow about the two-charts-in-one strategy. Enjoy!
Bonus: Download the Materials
Download the Excel FileShare Your Feedback
Nearly all of the contestants requested friendly feedback on their graphs. In most cases, contestants were trying these charts for the first time and thinking about whether or not these charts could be adapted for their datasets. What do you think?
8 Comments
Hey Ann – in the slides at the end of your post you ask “Why make one of these?” referring to the regular stacked bar chart “When you can make one of these?” then referring to the diverging stacked bar chart. Well, I think there is a really good reason *not* to make the diverging stacked chart and to stick with the traditional.
The diverging stack bar deceives the eye into thinking there is another data point in the horizontal distance from the start point of each stacked bar chart. In the diverging chart, this extra piece of eye-candy makes it much more difficult to compare the response proportions in each answer.
You will note how in the non-diverging chart there are no labels on each of the response proportions, yet one can visually understand how responses differed for each of the three questions. If you took away the answer labels from the diverging chart, it would be impossible to quickly determine how the proportions compared.
As you know I’m a big fan of your blog and this series. I think it is great that you push us all to keep our skills sharp and to grow. However, I just can’t get on board with this visualization. I think it might be interesting to engage your audience not just on how they can make cool visualizations, but when we need to check ourselves and prioritize reader comprehension of cool looking charts.
Ultimately, data visualization is powerful in so far as it conveys information simply and in an engaging manner. You cannot have one piece without the other.
David,
This is why I love blog discussions. You’ve brought up excellent points.
1) Yes, absolutely, every single adjustment to a chart changes what part of the data is emphasized or de-emphasized. This is part of the evaluator’s job as the storyteller, right? We guide stakeholders through a sea of numbers and help them pick out the most important information. In a traditional stacked bar chart, the reader can make part-to-whole comparisons; that is, strongly agree vs. agree, or strongly agree vs. agree/disagree/strongly disagree lumped together, or strongly agree/agree vs. disagree/strongly disagree, etc. In contrast, diverging stacked bar charts intentionally focus the reader’s attention on collapsed categories; that is, just the strongly agree/agree vs. disagree/strongly disagree finding.
2) Again, yes! The reader’s comprehension is central. That’s exactly what this evaluation and dataviz work is all about. I’ve had great success with clients understanding diverging stacked bar charts. The captions above the charts are crucial. I used to label charts as “chart 1” or “chart 2” but clients really benefit from the captions. (Unfortunately, not all charts are successful… Social network maps haven’t gone over as well: http://www.visualisingdata.com/index.php/2013/05/conquering-the-dusty-shelf-report-data-visualization-for-evaluation/)
My goal in facilitating these dataviz challenges is to expose my readers to a variety of chart types and help them think through the pros and cons of each style, as you’ve done. Stay tuned for a future post, “1 Dataset, 10 Different Charts,” that shows how the same results can be shown at least 10 different ways and discusses the advantages and disadvantages of each chart type.
Ann
Congrats to all but mainly to you Ann because of challenging us!-)
(uh… I hope “challenging us” is not misunderstanded translation of my not at all offensive idea)
LOVE LOVE…totally LOVE these strategies and the way you’ve presented them in the slideshow! I would never have thought to make separate charts and leave column A out of the chart (the text that would appear on the y-axis otherwise) and put that text in text boxes. Can’t wait to use this! Thank you! ——> 🙂 🙂 🙂
A few observations.
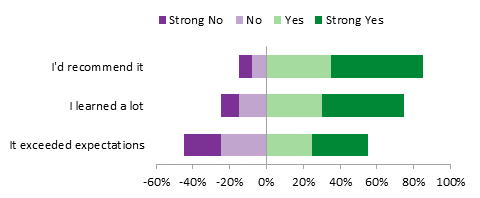
1. It is customary to draw positive responses to the right and negative to the left.
2. It’s very easy to make this with one chart, not two overlaid charts. Use negative numbers for the negative responses, and Excel will plot them to the left of the vertical axis, while the positive numbers for the positive responses will go to the right.
3. Keep the vertical axis in place to help your readers understand the chart.
4. If you have a neutral category, as any good survey does, split the neutral responses in half, plot half to the left and half to the right, so the neutral bar appears to be bisected by the vertical axis, between disagree and agree.
Jon,
Thanks for reading!
1. In other fields, yes, I’ve definitely seen positive responses to the right instead of to the left. Jozsef Hornyik arranged his entry this way (http://bl.ocks.org/CodeXmonk/6262477). I put positive responses to the left because that’s how I structure surveys (the check boxes for strongly agree are to the left). I follow Dillman’s (2008) suggestions for survey design. Although as I write this, I realize 2008 was a while ago, so perhaps there are newer suggestions for survey design? I should see if Dillman has a new book out…
2. Yep, you’re right, these charts can be made with the floating white bars technique too. I had already shared my spreadsheet for that technique here (http://emeryevaluation.com/2013/08/07/chart-colors/) and Stephanie Evergreen blogged her solutions to the dataviz challenge here (http://stephanieevergreen.com/diverging-stacked-bars/). So, the purpose of this post is to share an alternate solution.
3. I’m not sure what you mean about the vertical axis.
4. Yep, if I had a neutral category, I could split it. A bunch of the contestants did this, and David Bonachea even shared a screenshot of his Excel formula for splitting the neutral category (http://annkemery.tumblr.com/post/60407970083/check-out-david-bonacheas-entry-to-dataviz).
We’re going to have to agree to disagree that “any good survey” has a neutral category. The “how many points on a scale are best? 4, 5, 7, 9?” debate has been going on forever in evaluation and I have no desire to jump into that today, ha! 😉
Thanks! Ann
1. I don’t recall seeing survey questions that have positive responses before (left of) negative responses. It seems backwards. But definitely when plotting numerical values it is customary that negatives are to the left and positives to the right. Disagree is negative and agree positive, so by this logic, it seems to me…
2. I’ve seen several tutorials (not just diverging stacked bars) that try to overlay two charts. It seems not worth the trouble, because preserving alignment of the two charts and their axis scales can be problematic. Using one chart for this exercise is as difficult as multiplying some values by -1.
3. I posted a quick sample chart at
http://peltiertech.com/images/2013-09/SampleDivergingBars.png
The vertical axis may help the reader see where positives and negatives diverge.
4. The chart I posted was made using a prototype of a new Excel add-in I’ve been working on. It uses similar formulas to split the neutral responses and arrange the data so the legend entries are in the correct order. Smoke and mirrors are the biggest part of Excel charting.
5. As a survey taker, I don’t like having to choose between Agree and Disagree when I don’t care. That’s why I said a survey should have a neutral option. I don’t see why you would need more than 5 responses, though. We’re measuring subjective feelings, not atomic properties.
6. The prevalence of this topic in the blogosphere lately inspired me last week to write up some thoughts on presentation of survey results, including these diverging bar charts:
http://peltiertech.com/WordPress/charting-survey-results/
[…] you’ve mastered the basic bar chart, try your hand at one of these newer variations, like a diverging stacked bar chart, floating bar chart, or small multiples bar chart. The bar chart’s versatility make it the […]