
Are you working on a year-end infographic?
Maybe you’d like to showcase your company’s achievements over the past year.
Maybe you’d like to celebrate your own achievements.
Infographics are a great way to visualize key points (without boring our audiences, which can happen in lengthy reports).
Back in December 2022, Sue Griffey brought her draft infographics to our weekly Office Hours.
In this blog post, you’ll see Sue Griffey’s annual infographic for her global mentoring practice, SueMentors.
You’ll also see several of Sue’s drafts. I hope this behind-the-scenes view helps you develop your own infographic.
Watch the Progression
You can watch Sue’s progression here.
This is a 7-minute segment from an hour-long Office Hours session.
Here’s what’s inside.
Sue’s Previous Infographics
First, Sue shared three examples of past years’ infographics.
Draft 1: Six Tiles of Content
Then, we talked about orientation.
Should her infographic be square?
Rectangular??
Portrait???
Landscape????
A single image?????
Several standalone images??????
A decade ago, infographics were mostly portrait. I’ll never forget Chris Lysy’s cartoon from 2014, where he joked that 2:32 aspect ratio infographics could practically be used as belts.
Nowadays, infographics can be any orientation. Ideally, we’d customize the infographic to the platform where it’s being shared.
For example, Instagram used to require squares, although you can upload square or rectangular images nowadays. And now the algorithm prefers short video Reels over images. It’s tough to keep up!
What does LinkedIn’s algorithm prefer? That’s Sue’s primary platform for connecting with others. Should her infographic be square? Rectangular?? How about both???
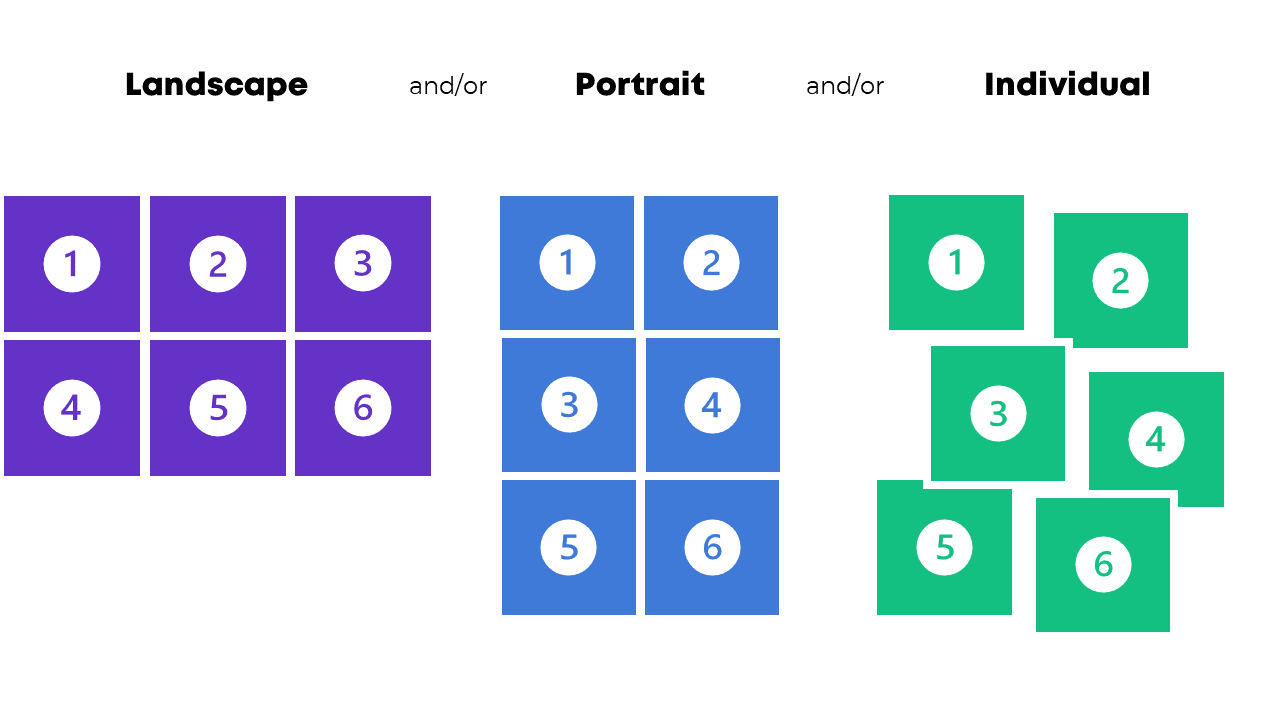
We considered a modular, grid-like design.
Sue already had 6 buckets of information. What a nice round number!
That means she could organize her 6 existing topics in landscape…
…and/or portrait…
…and/or as 6 individual social media posts.
In the video, you’ll see Sue’s very first draft:
Draft 2: Adjusting Colors and Adding Visuals
Next, Sue “softened all the brand colors.”
She added icons.
She added white overlays to de-emphasize the icons.
Draft 3: Focusing on Brand Blue
Sue decided to go back to “one panel of blue” (her brand color).
She added a “road map” within the TV icon.
She created a bit.ly link so that readers could learn more.
She continued softening the icons.
“I challenged myself to take out even more words,” Sue explained.
Final Version: Smaller Boxes with More “White” Space
On New Year’s Eve Day, Sue finished her “80% is good enough” final draft.
She made the boxes smaller, which added more “white” space between the buckets of information.
Next Steps
In all her “spare” time, Sue might write a long-form blog post to elaborate on each of these 6 topics.
(She did provide additional details in a document shared publicly on Dropbox, too.)
But, as we discussed in the video, “there are endless ways to recycle content.” At some point, we have to create deadlines for ourselves and move on to the next item on our to-do lists.
Software Used: Microsoft PowerPoint
During Office Hours, another participant asked Sue which software platform she used to create her year-end infographic.
It’s PowerPoint!
Sue said, “It’s the easiest way to move photos around and to keep graphics together.”
In a previous Office Hours, we opened Canva together and browsed their year-end infographic templates. I wasn’t impressed. There were just bullet points, icons, and photos—all of which can be handled inside PowerPoint, too. Plus, Sue’s already comfortable in PowerPoint. Every new software platform has a learning curve. We can’t spend time learning them all. PowerPoint worked perfectly fine and there was no reason to switch.
“I did feel like I was moving information around and conveying things much better than I did a year ago,” Sue said. I agree. Well done!!!
Connect with Sue Griffey
You can view Sue’s infographic on LinkedIn here.
And don’t forget to connect with Sue on LinkedIn.
Leave a Reply