If you use spreadsheets on a daily basis, this post isn’t for you.
Within the past year I’ve led 61 trainings (and counting!) about both data analysis/statistics and data visualization. In each session, there’s one person who’s enthusiastically eager to learn but has almost zero experience with spreadsheets.
Spreadsheet novices, rejoice! This one’s for you.
Key Spreadsheet Terminology
Sometimes Excel novices say that learning to use Excel is like learning a new language. Here are some key Excel terms to get you off to a good start.
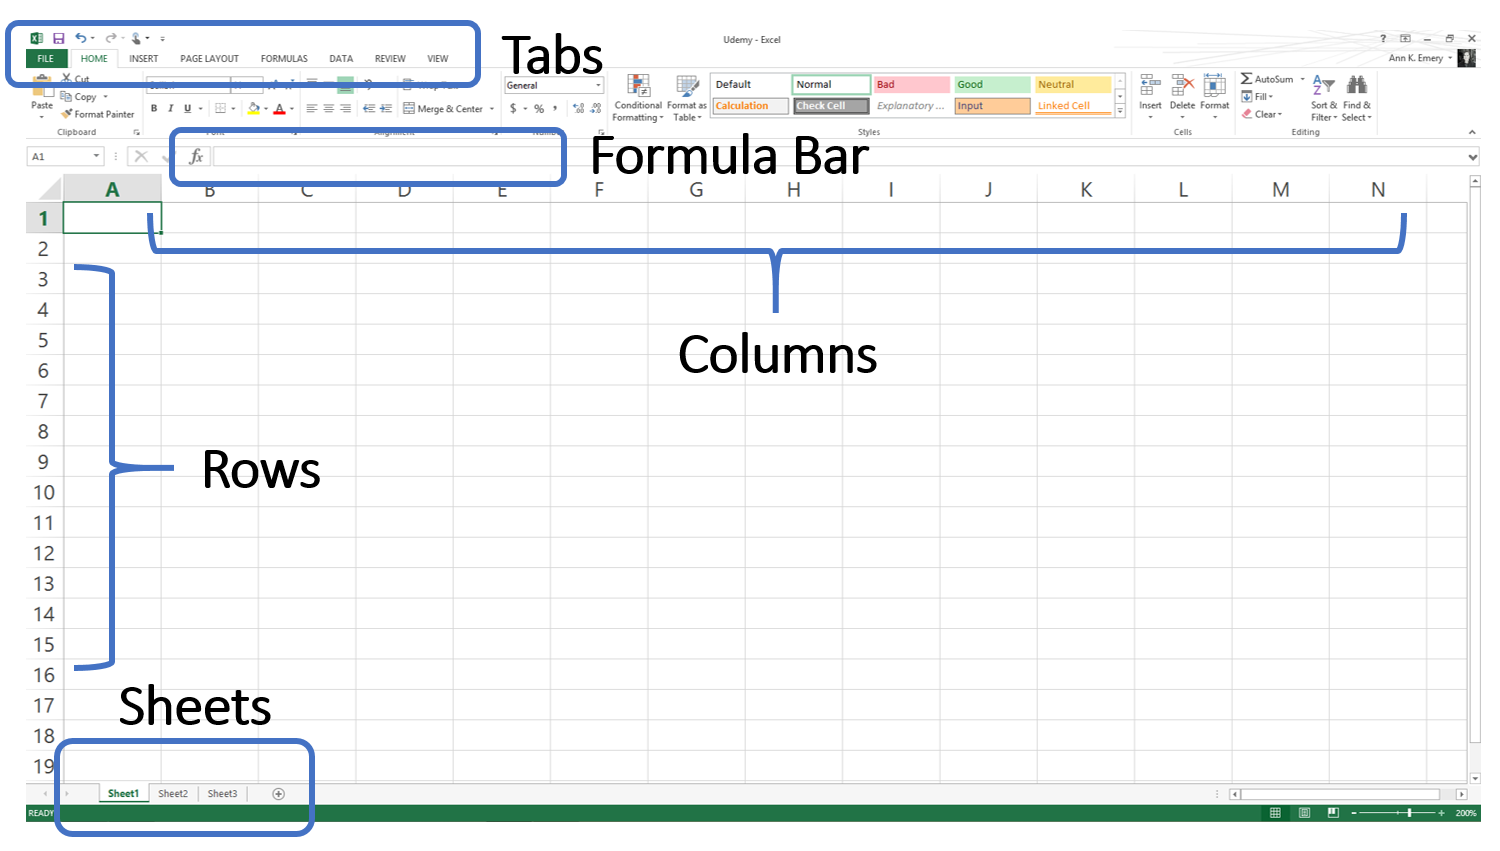
Your entire Excel file is called an Excel workbook.
Your workbook will probably include multiple sheets. When you open a new file, you’ll see Sheet1, Sheet2, and Sheet3 included along the bottom of your screen.
Your sheets are organized into tabular Columns and Rows.
Tabs are displayed across the top of your Excel workbook. Each tab contains a variety of incredible features. For example, the Home tab contains features that let you format text and numbers. The Page Layout tab is where you adjust printer settings and the Data tab contains a sorting button.
Finally, the Formula Bar is where you’ll get to view formulas that are typed into your spreadsheet.

Basic Text Formatting
Novices are often pleasantly surprised to learn how many similarities exist between Microsoft products like Excel, Word, and PowerPoint. Whether you need to format text, adjust colors, or insert images, you can apply your existing Word and PowerPoint skills as you begin using Excel.
Just like with Word and PowerPoint, you’re not stuck with regular ol’ text inside of Excel. You can adjust some or all of your spreadsheet’s contents to bold, italic, or underlined numbers and letters.

Adjusting Colors
Colors are highly customizable in Excel, just like in Word and PowerPoint.
Change your font’s color with the Font Color button on the Home tab.
Or, fill in your cells with the Fill Color button on the Home tab.

Inserting Images
Want to include your organization’s logo within your spreadsheet?
Images are just as easy to use in Excel as in Word and PowerPoint.
Head over to the Insert tab and click the Pictures button.
Then continue formatting your image — re-sizing, re-coloring, flipping, etc. — just like you normally would.
Building Diagrams with SmartArt
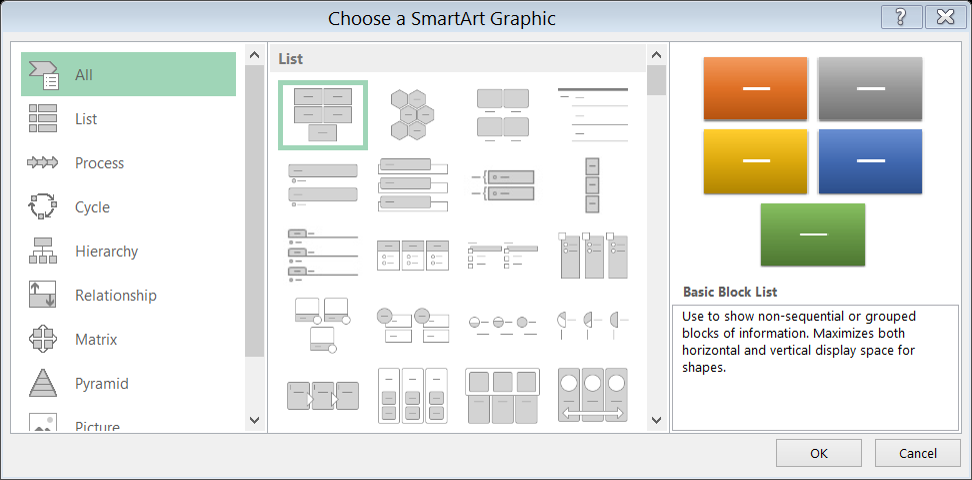
I primarily use SmartArt within my PowerPoint slides or Word documents, but sometimes diagrams are helpful in my Excel file, too.
Head over to the Insert tab and click the SmartArt button to see all your options. I tweak each diagram’s colors and fonts for a customized look.
Inserting Hyperlinks
It’s easy to include hyperlinks inside your spreadsheet.
Just type the link, and when you hit Enter on your keyboard, the text will magically turn itself into a hyperlink.
Right-click on the hyperlink and select Edit Hyperlink to display new text for the link, like Link to Udemy text from our example.
If you don’t need the hyperlink anymore, simply delete the cell’s text, or just right-click on your link and select Remove Hyperlink.
3 Comments
I really like your blog post and like the way you describe the overview of whole excel.Thanks for sharing content with us.
Hi,
Nice site with lot ot information.
How do you make these GIF’s.
Regards
Krish
Bravo! thanks for all your wonderful and user-friendly guide. Cheers