3 Comments

  • Very nice. I like it.

  • George Mount says:

    Beautiful! I love that you included a picture of the sketched prototype as a reminder to, ahem, sketch something before futzing around with Excel charts!

  • baconxl says:

    A variation of this trick will allow you to make side-by-side stacked column charts, as well!

  • Leave a Reply

    Your email address will not be published. Required fields are marked *

    How to Add Intentional Gaps Between Bars/Columns in Microsoft Excel

    Updated on: Jul 5th, 2016
    Data Visualization in Excel
    , , ,

    In my prior post, I sketched a few options for a performing arts organization’s fictional ticket sales data:

    Sketch of chart.

    I intentionally separated the year-by-year columns from the total column with a little extra space. I don’t want all the columns mushed together.

    Easy to sketch on paper.

    But easy in Microsoft Excel?

    Yes!

    Here’s the default Excel graph.

    Yuck.

    Basic excel stacked bar chart.

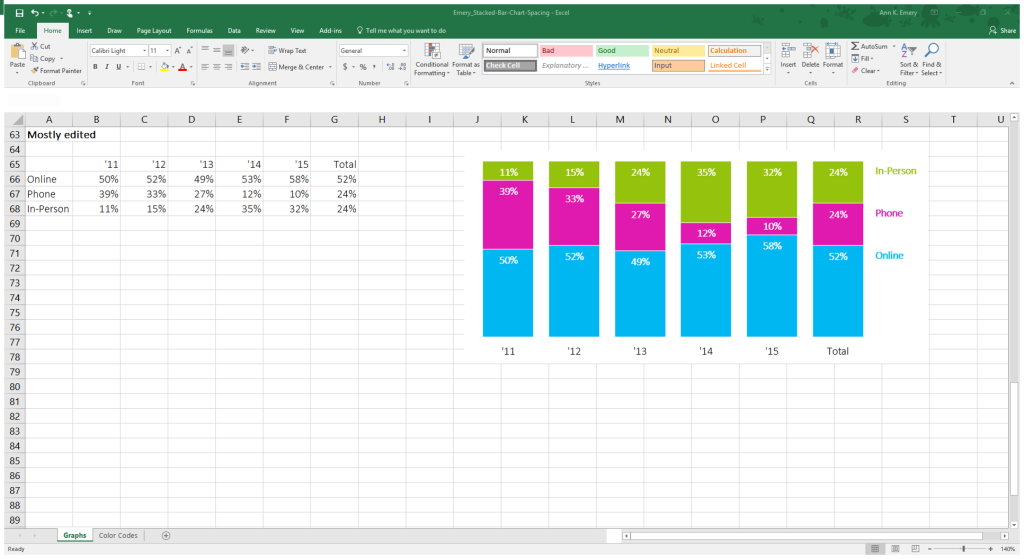
    Here’s the mostly edited version: reduced clutter; custom color; labels directly beside the data; reduced gap width.

    Edited stacked bar chart in Excel.

    The secret strategy for nudging one of the columns over to the right: Add an empty column to your data table.
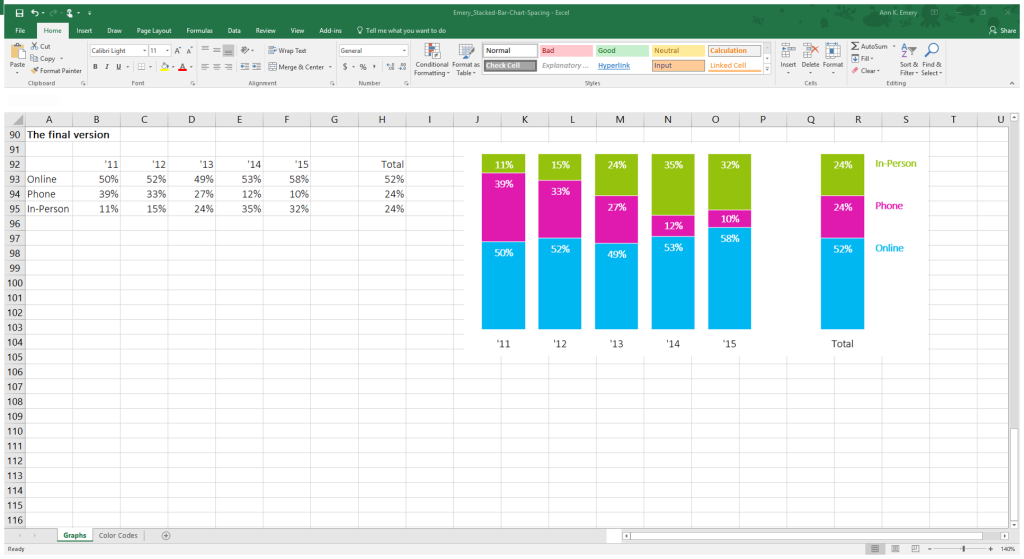
 Edited stacked bar chart in Excel with an extra column added.

    More about Ann K. Emery
    Ann K. Emery is a sought-after speaker who is determined to get your data out of spreadsheets and into stakeholders’ hands. Each year, she leads more than 100 workshops, webinars, and keynotes for thousands of people around the globe. Her design consultancy also overhauls graphs, publications, and slideshows with the goal of making technical information easier to understand for non-technical audiences.

    3 Comments

  • Very nice. I like it.

  • George Mount says:

    Beautiful! I love that you included a picture of the sketched prototype as a reminder to, ahem, sketch something before futzing around with Excel charts!

  • baconxl says:

    A variation of this trick will allow you to make side-by-side stacked column charts, as well!

  • Leave a Reply

    Your email address will not be published. Required fields are marked *

    You Might Like

    Our complimentary mini course for beginners to dataviz. Takes 45 minutes to complete.

    Enroll

    How to Bring Your Technical Tables to Life

    Just because I’m pro-graph, I’m not anti-table. Technical tables have so much value, especially as visual appendices for reports. In this blog post, you’ll get ideas for bringing your technical tables to life.

    More »

    Need practical how-to tips? In this course, you’ll learn how to make great graphs inside software you already have. Includes beginner, intermediate, and advanced tutorials for making charts from start to finish.

    Enroll

    Subscribe

    Not another fluffy newsletter. Get actionable tips, videos and strategies from Ann in your inbox.