
I recently had the chance to talk with Steve Wexler, founder of Data Revelations, author of The Big Picture: How to Use Data Visualization to Make Better Decisions- Faster and co-author of The Big Book of Dashboards: Visualizing Your Data Using Real-World Business Scenarios.
Steve joined as a special guest for the Dashboard Design Full Course where participants get hands-on training and access to special guest speakers in real time.
Watch Our Conversation
You can watch Steve’s session here:
What’s Inside
Here are some of the topics we talked about.
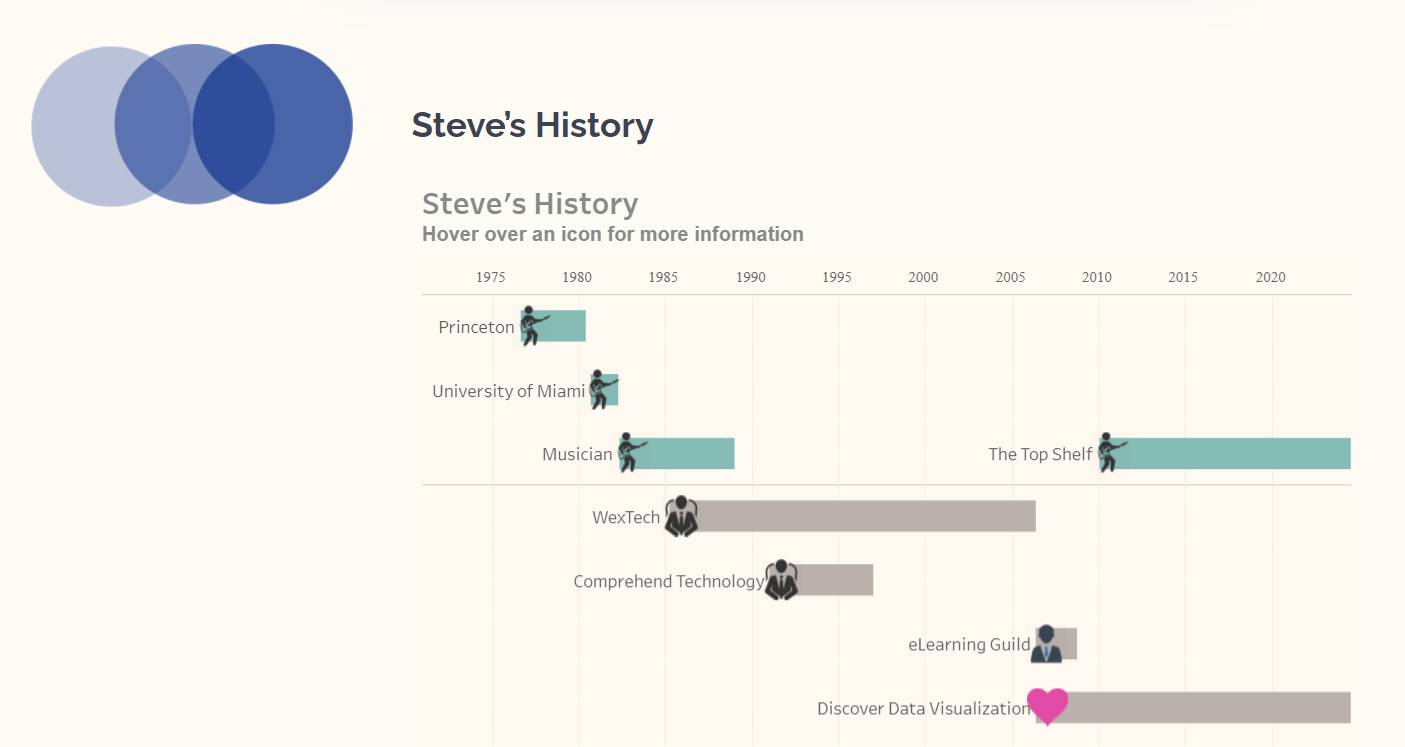
- Steve’s career prior to data viz and book writing. Steve shared that his background was as a musician but, “after plying my trade for a while, I needed to supplement my income and go into personal computers. Ended up doing a lot of consulting on Excel and Word. And did a lot of work with and for Microsoft and then ran my own software company.” About 10 years ago he started his own company as data visualization consultant with a specialty in visualizing survey data. You can visit his website to see an interactive timeline of his career: https://www.datarevelations.com/about-us/.
- How he found Tableau. While working with the Learning Guild, Steve suggested they use interactive dashboards using Spotfire software. They were on board but asked him to research other software which led him to Tableau. “The ace in the hole that Tableau had was undo,” he said.
- The Big Book of Dashboards: Visualizing Your Data Using Real-World Business Scenarios. Steve explained that the book has 28 different business scenarios with ideas of how to present data. It includes examples of what other companies are doing, gives an overview of data visualization as well as includes how to navigate tricky situation (i.e. your client only wants pie charts, only uses red and green). He cautioned though that, “You’re going to fail a lot in trying to get people to adopt [new ways] and don’t feel bad. Think of yourself being like a major league ball player, if you succeed 30% of the time, you’re an all-star.”
- Ann’s favorite part of The Big Book of Dashboards. Ann loved that the book is highly visual, with just 30 pages of best practices, and that the rest is case studies. She often uses the case studies as a resource with clients when they ask for examples.
- The goal of data visualization. Steve said that if you’re in data visualization, your goal should be to “provide the greatest degree of understanding with the least amount of effort for your audience.”
- Why he loves collaboration. Steve coauthored a book with two others and said he often gets asked how three people could write a book together. He shared that they were all aligned on their goal and that he liked having people who challenged him. He invited the idea that his collaborators were coming from a different backgrounds and expertise and, “that this could be someone who’s not looking at it identically to me and that could be great.”
- The Big Picture: How to Use Data Visualization to Make Better Decisions – Faster. Steve shared that book is “for organizations that have not yet embraced how transformative good data visualization can be.” This book came out from workshops from his first book where he realized that a lot of people had no idea what data visualization was or how to interpret it.
- Ann’s favorite part of The Big Picture: How to Use Data Visualization to Make Better Decisions – Faster. Ann’s favorite part is the scaredy-cat icon, which represents caution/what not to do and clearly distinguishes that for the reader.
- Steve’s next book. While Steve hopes to write more books, he’s hoping the next one is text-only, like a novel. “The amount of extra work that needs to go into producing something that is high quality and the angst that’s associated with it… It’s worth it, it’s wonderful, but it’s a fair amount of extra work,” he said.
- Steve’s favorite part of the The Big Picture: How to Use Data Visualization to Make Better Decisions – Faster. Steve’s favorite chapter is the 8th chapter, which covers why knowing your audience is so important. He said he wants to get people thinking about, “how do I best serve my audience?”
- Audience Q&A. At the 45:00 mark, Steve also answered some audience questions about Tableau, offered to help track down a classic data visualization, and shared how he views the connection between data visualization and storytelling.
Connect with Steve Wexler
Download the Introduction to The Big Picture: www.bigpic.me
Twitter: https://twitter.com/DataRevelations
LinkedIn: @swexler
Website: https://www.datarevelations.com/
Leave a Reply