4 Comments

  • Ann K. Emery says:

    And here’s an article I just discovered from Super Niemie’s blog on using small multiples word clouds and small multiples social network maps: http://superniemie.wordpress.com/2014/01/02/small-multiples-for-qualitative-data/

  • […] your viewers need to make comparisons across four different variables simultaneously through a small multiples layout. But yes! Your brain! It […]

  • […] closely, can you see the small multiples blog post peeking through on the other side of the page? Start with sketching and your life will be 1,000,000 […]

  • […] too zig-zaggy and criss-crossy, try breaking the single graph into three separate graphs with a small multiples […]

  • Leave a Reply to Ann K. Emery Cancel reply

    Your email address will not be published. Required fields are marked *

    Los Angeles, San Francisco, Denver, Buffalo, Indianapolis, Milwaukee, Kampala, DC… it’s been a wonderful few months in the data visualization workshop world!

    My favorite part of data visualization workshops?

    The airports. Kidding.

    Watching jaws drop when folks are introduced to small multiples layouts for the first time. Definitely!

    What are Small Multiples?

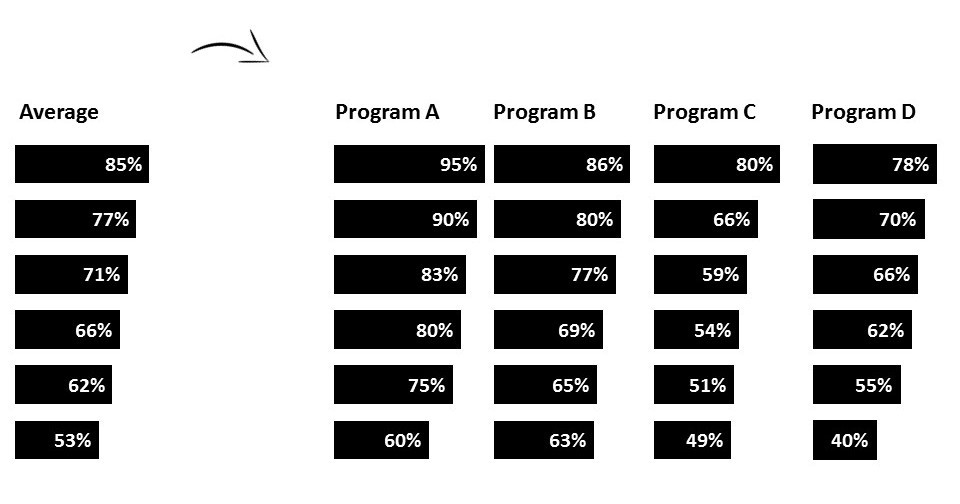
    Small multiples layouts include 2 or 3 or 4 or more graphs – of the same size and scale – to allow for easy comparisons.

    Why Use a Small Multiples Layout?

    Old way: making a single aggregate chart that only displays means, medians, or frequencies from a bunch of different data series combined.

    New and improved way: designing a small multiples layout that gives viewers the information they really care about – the disaggregated data for their particular company, city, organization, or school.

    Additional benefits:

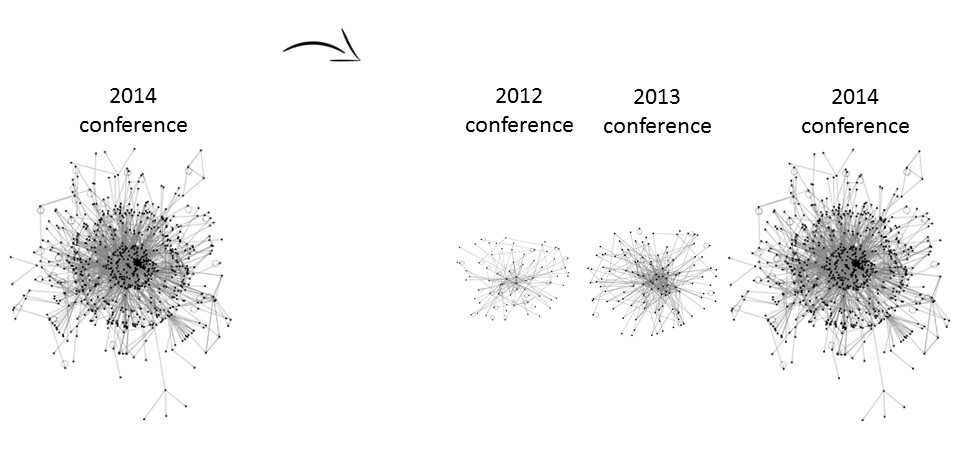
    • To compare changes over time, like the social network map below.
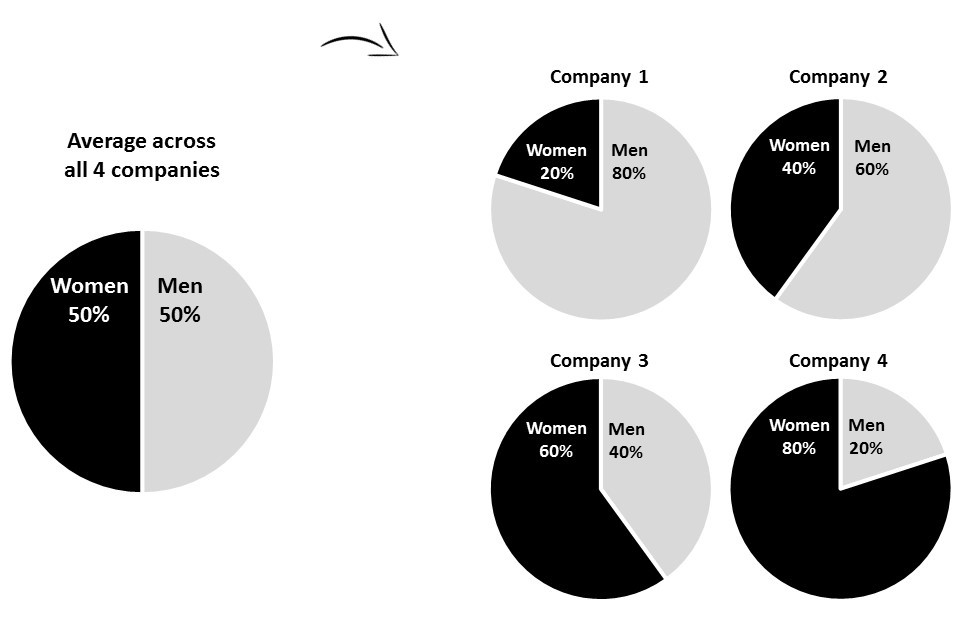
    • To compare changes across different groups.
    • To add context. Is an organization doing well? Who can really know for sure unless you compare the organization to a few others using a small multiples layout?

    What Can Be Made into a Small Multiples?

    Anything.

    Bar charts, histograms, geographic maps, line charts, social network maps, and more.

    Make a collage of several small charts. It’s really that easy.

    You can make these in nearly any software program. If they aren’t part of your software program’s menu of default options, don’t be afraid to dive in and use a little elbow grease.

    Examples of Small Multiples

    Here are a handful of the million+ ways to incorporate small multiples layouts into your charting repertoire:

    Example of a small multiples chart. Example of a small multiples chart using outlines of the United States. Example of a small multiples chart using network maps.Example of a small multiples chart using a histogram. Example of a small multiples chart using pie charts.Example of a small multiples chart using line charts.

    Your Turn

    Have you seen excellent small multiples charts in the wild? Link to your favorite examples here!

    More about Ann K. Emery
    Ann K. Emery is a sought-after speaker who is determined to get your data out of spreadsheets and into stakeholders’ hands. Each year, she leads more than 100 workshops, webinars, and keynotes for thousands of people around the globe. Her design consultancy also overhauls graphs, publications, and slideshows with the goal of making technical information easier to understand for non-technical audiences.

    4 Comments

  • Ann K. Emery says:

    And here’s an article I just discovered from Super Niemie’s blog on using small multiples word clouds and small multiples social network maps: http://superniemie.wordpress.com/2014/01/02/small-multiples-for-qualitative-data/

  • […] your viewers need to make comparisons across four different variables simultaneously through a small multiples layout. But yes! Your brain! It […]

  • […] closely, can you see the small multiples blog post peeking through on the other side of the page? Start with sketching and your life will be 1,000,000 […]

  • […] too zig-zaggy and criss-crossy, try breaking the single graph into three separate graphs with a small multiples […]

  • Leave a Reply to Ann K. Emery Cancel reply

    Your email address will not be published. Required fields are marked *

    You Might Like

    Our complimentary mini course for beginners to dataviz. Takes 45 minutes to complete.

    Enroll

    The Data Visualization Design Process: A Step-by-Step Guide for Beginners

    Visualizing numbers in charts, graphs, dashboards, and infographics is one of the most powerful strategies for getting your numbers out of your spreadsheets and into real-world conversations. But it can be overwhelming to get started with data visualization. In this step-by-step data visualization guide for beginners, I’ll walk you through the data visualization design process so that you can transform your spreadsheets into stories.

    More »

    Inside our flagship dataviz course, you’ll learn software-agnostic skills that can (and should!) be applied to every software program. You’ll customize graphs for your audience, go beyond bar charts, and use accessible colors and text.

    Enroll

    Subscribe

    Not another fluffy newsletter. Get actionable tips, videos and strategies from Ann in your inbox.