
I recently had the chance to talk with Emily Mills, who is a professional illustrator and expert in sketchnoting. She is also the founder of the Sketchnote Academy and author of The Art of Visual Notetaking.
Emily was a guest speaker in our Report Redesign course. She walked us through the basics of sketchnoting, her career, why hand drawn images stop the scroll, the cool brain science behind sketchnoting, and then led us through some drawing exercises. We wanted to share Emily’s tips with you, too!
Watch Our Conversation
What is Sketchnoting?
Emily explained that sketchnoting is when you’re writing and drawing at the same time. “The whole purpose to remember information, and it’s just more engaging and interesting to look at,” she said.
Sketchnoting is also called:
- Visual notetaking
- Graphic recording
- Visual facilitation
- Graphic facilitation
What is Sketchnote Academy?
Emily founded Sketchnote Academy in 2018. She offers online courses to help you learn how to sketchnote and then level up your skills.
Emily’s Previous Career Experience
Emily Mills’ background is in graphic design. She was an in-house designer in education, nonprofit, and a healthcare start-up. “I just get bored doing the same thing year after year like an annual report… again. While the data, pictures and information might change, it was still the same project… year after year,” she said.
How Emily Got Started with Sketchnotes
Emily fell into sketchnoting from a weekly cartoon that she would draw on a whiteboard outside her office.
She said that a former co-worker remembered those cartoons. When he went to work at a video studio, he contacted her, saying “We just booked a video client for something called a whiteboard video. We don’t really know what it is, but we need somebody to draw for it. Will you come to Houston and draw for our video?” Emily agreed and created a whiteboard video with them.
“I was really proud of it and I put it online. Someone found it through keywords and hashtags and they said, “This is so cool! Have you heard of sketchnoting?” I hadn’t but [realized] it was pretty much the same thing,” she said. After that, she attended a sketchnote-specific workshop, and then challenged herself to sketchnote every day for a month.
Hand-Drawn Images Stop the Scroll
Emily once shared with Ann that hand-drawn art/graphics get more view time than stock photos or computer generated graphics. Ann asked her to tell us more as we’re all trying to create reports that people *actually* want to read.
Emily explained how hand-drawn images can stop the scroll.
If you think about your average Instagram feed, she explained, you’re probably seeing mostly pictures, some stock photos,, an inspirational photo with a quote on it. She said that we’re used to those images now, and our brains are automatically thinking, “I’ve seen this before; show me something new.”
Emily said when you see something different like a hand-drawn cartoon or someone’s artwork, you really stop because of human curiosity. “We keep asking questions,” she said. “Hand-drawn images invoke a lot of our human curiosity and take longer to engage with because you’re asking those questions.”
The Cool Brain Science Behind Sketchnoting
“Drawing is what I call the human language,” Emily said.
Drawing was around before written language. We’ve been communicating in pictures for thousands of years.
Studies also show that pairing an image with words also allows for better brain retention than just images or words alone.
Drawing Data Can Help Simplify Data
She gave an example of being at a conference where the speaker has a PowerPoint slide with a huge pie chart with 10 different slides and lots of labels.
If you’re trying to take visual notes, there’s no way you can capture that entire pie chart, all the data points, and what all the colors mean.
“But there’s usually one story that you’re trying to communicate with your data,” she said. Focus on just that main point rather than try and capture every single detail.
Drawing Can Help You Sketch Drafts Quickly
Emily said she was taught in design school that you don’t even touch the design software until you have 50 designs drawn on paper first.
“The reason is, it’s tracking your progress. I’m forced to go slow because I’m limited by how fast I can draw,” she said.
She suggested giving yourself 30 seconds to draw what you’re trying to communicate. Then give yourself 10 seconds and then 5 seconds. This will allow you to see what you’re naturally drawn to and what can get cut.
“See what you’re cutting and what you’re keeping, and that’s your data story. That’s the main point,” she said.
Sketchnoting with Emily
Materials needed: Pen and paper (preferred) but an iPad is fine too.
Emily gave us an introduction to drawing that you can follow along with. She said that every single drawing can be condensed into three things:
- A dot (a point)
- A line (a dot that went on a trip)
- A shape (a dot that went on a trip and came back home)
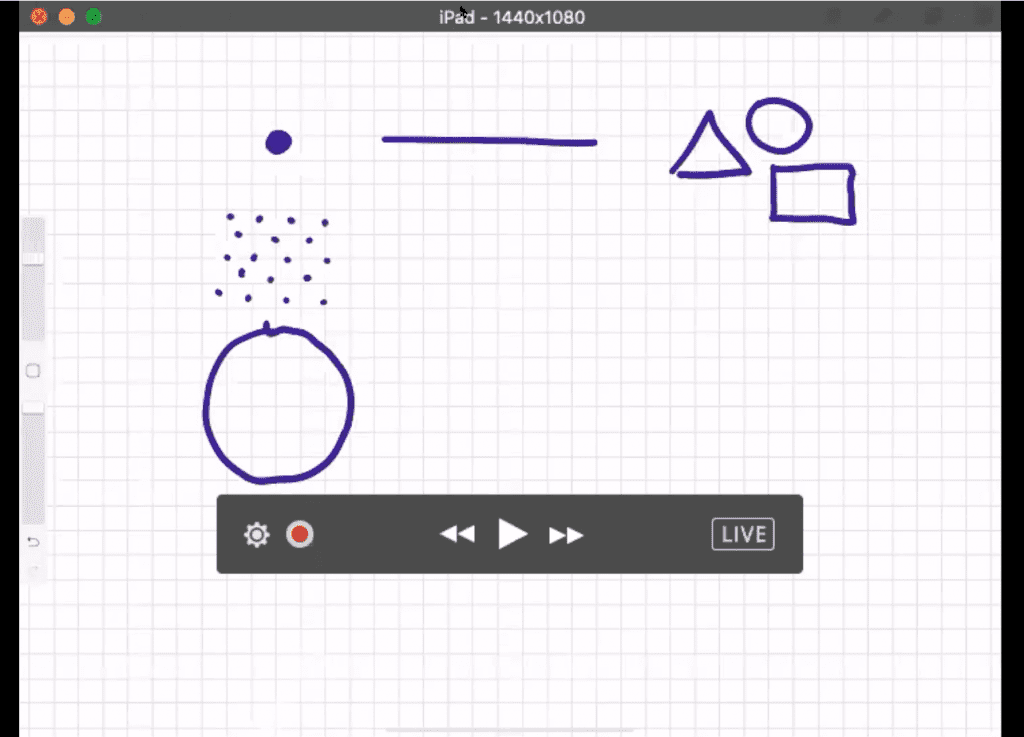
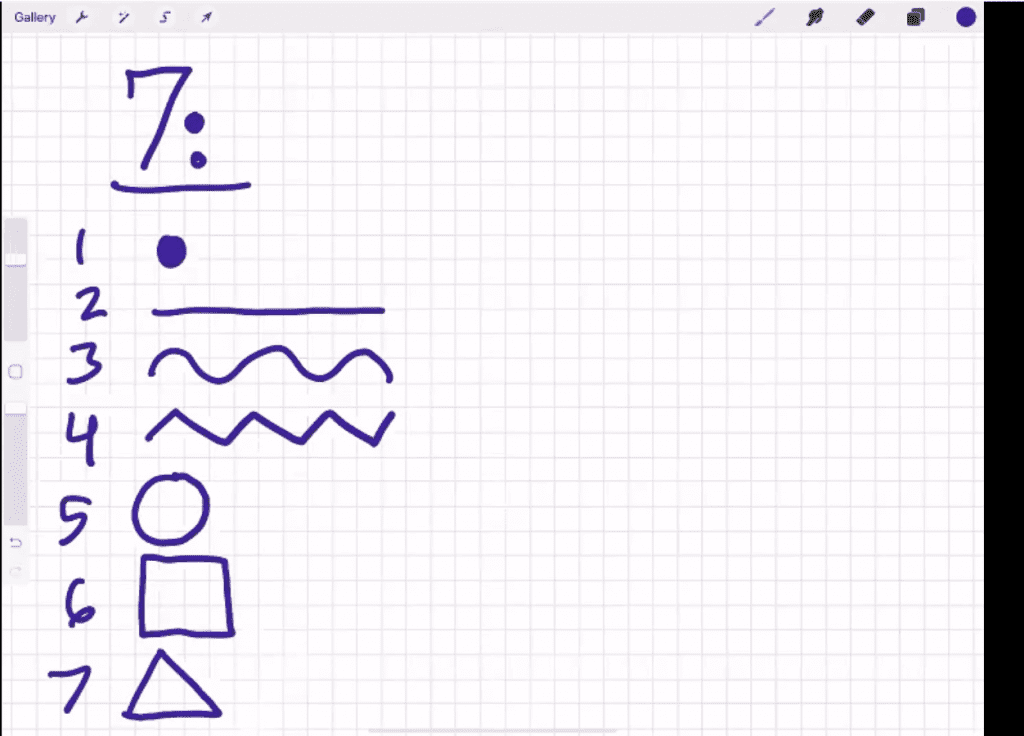
She then shared the seven building blocks of all drawings:
- Dot
- Straight line
- Curvy line
- Crooked line
- Circle
- Square/Rectangle
- Triangle
Her final tip: Go for recognizable rather than realistic.
Grab your pen and paper and join in!
Connect with Emily Mills
Instagram: emily_a_mills
Free Course: Beginner Sketchnote Drawing
Your Turn
Comment with your favorite part of learning with Emily.
Leave a Reply