14 Comments

  • Nick says:

    Love waffle charts and have been using them a lot lately! Great alternative to the Pie! I found this link as well. It was a bit of work on the front-end, but then made it helpful to be able to save the doc and enter my % for new charts without having to manually fill in the bar colors each time. http://datapigtechnologies.com/blog/index.php/building-waffle-charts-in-excel/

    • Ann K. Emery says:

      I don’t think I’m patient enough to follow that tutorial…. In real life, I use conditional formatting, which is the demo shown in the 1-minute video at the end of this post. But in real life I also primarily work with non-data people who love the simplicity of building a waffle from a stacked bar chart, hence this blog post. I love that there are workarounds for anything and everything.

  • Molly says:

    Hi Ann. Thanks for the post. I was able to replicate your first waffle chart. Is the waffle chart with the v lookups, drop downs and conditional formatting for purchase?

  • Andy Ferguson says:

    Interesting approach. As an alternative, I don’t use charts at all for waffles, but do it all in cells with formulae and conditional formatting. Using the same range as your example, enter in cell A10
    =(COLUMNS($A:A)+((ROWS(10:$10)-1)*10)<=$K$1)*1
    Copy across and up to J1
    Square up the cells, shade them light grey and add a white border. Make the font colour light grey as well.
    Use conditional formatting to make background and font the chosen highlight colour if cell value = 1
    Enter any number from 1-100 in cell K1

    • Ann K. Emery says:

      Conditional formatting is gamechanging, isn’t it? I usually teach the beginner to make waffles with Insert –> Shape, teach the intermediates to make waffles with stacked bars, and teach the advanced folks to make waffles with conditional formatting. Let me know if you have a spreadsheet/blog/tutorial describing your approach in more detail. I’d be curious to explore it.

  • David Osman says:

    Ann, do you have any tips on labeling the areas in your waffle chart? I see that you do some labeling through the title.

    • Andy Ferguson says:

      You could use overlaid text boxes with “No fill” to make them transparent and a formula that drives the label – something like
      =A1&” of “&”A2&”people agreed that they wanted to share their own story”
      You would need to have that in a cell, and the formula in the text box being just a cell reference, and you wouldn’t be able to replicate Ann’s mid-sentence format change (without going to multiple text boxes), but it would be dynamic.

  • Andy Ferguson says:

    Ann – that beginner / intermediate / advanced split is interesting personally, as my perception is different, probably due to my own preconceptions! I might write something up and send it across (I’m no blogger) if I get a chance.

  • Ann K. Emery says:

    Here’s a real-life example of waffle charts: https://www.bloomberg.com/news/articles/2017-10-17/smartphones-are-killing-americans-but-nobody-s-counting Scroll down to the “Fewer Than One in Seventy Road Fatalities Are Officially Linked to Cell Phone Use” section. I’ve got more examples at http://annkemery.com/portfolio/waffle/ to inspire you, too.

  • A detailed Explanation of a Waffle Chart. Many a times i don’t see people preferring waffle charts though its a good way of data representation.

  • Gloria says:

    Thanks Ann

  • Genius says:

    Thank you for imparting knowledge, this will really help me a lot when presenting data. I am not sure if I overlooked it or something, however, can you share with us the steps how to create a 3-product waffle chart? Thank you.

    • Ann K. Emery says:

      You can copy and paste your original chart… make a few tweaks… and then “group” all the charts together for an easy transfer from Excel into another program like Word or PowerPoint. Much faster than starting from scratch!

  • Leave a Reply to Ann K. Emery Cancel reply

    Your email address will not be published. Required fields are marked *

    How to Make a Waffle Chart in Microsoft Excel

    Updated on: Oct 10th, 2017
    Data Visualization in Excel
    , , , , ,

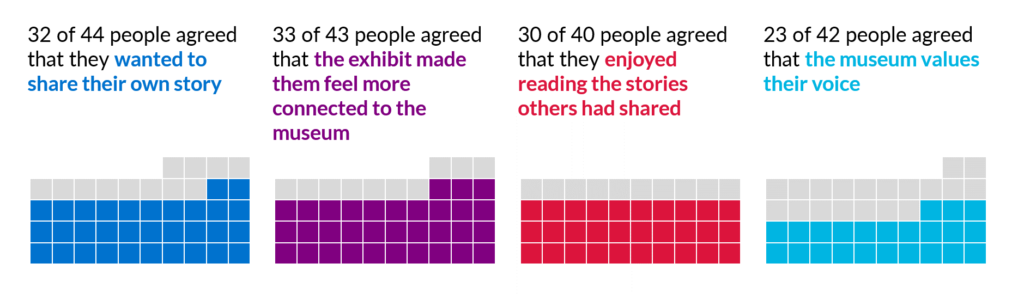
    Waffle charts display part-to-whole patterns. They’re kind of like square versions of pie charts. I introduced them in an earlier post about visualizing survey results. Look familiar?

    Finally, I built four square pies that draw attention to the strongly agree and agree responses. Square pies are a good option for small n's because each shape subtly reminds us that we're talking about a small group of real human beings. You could take this concept a step further by using illustrated icons instead of squares. But good luck finding an icon to represent feeling connected to a museum or having your voice valued...

    Here’s how to make waffle charts within good ol’ Excel.

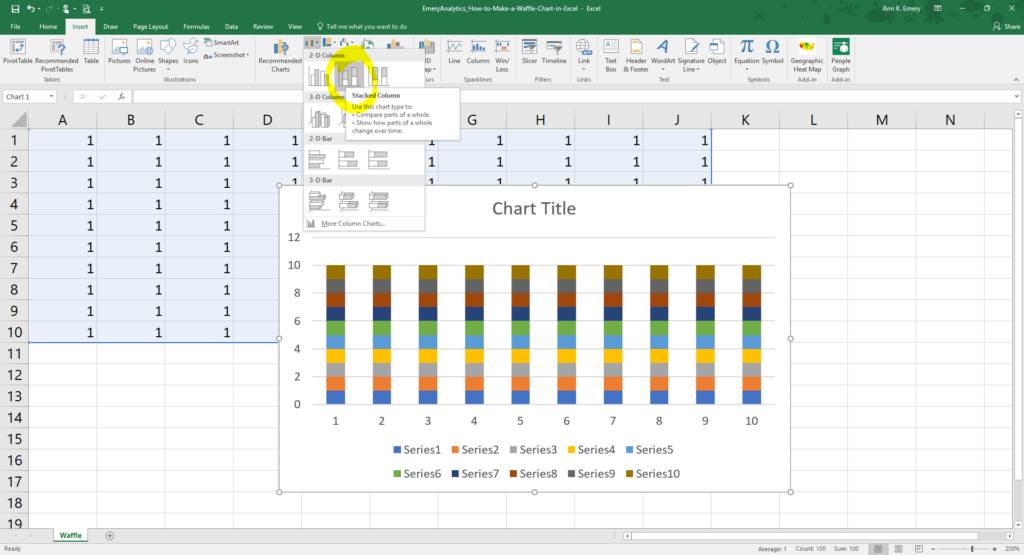
    The first few steps are a little unexpected. We’ve got to fool Excel into making a 10×10 grid. You’ll have to trust me on this first step. It’ll look crazy at first, but it’ll make sense in a moment. Type a bunch of 1’s into your spreadsheet—10 across and 10 down.

    Type a bunch of 1’s into your spreadsheet—10 across and 10 down.

    Then, highlight your 1’s, go to the Insert tab, and select a 2D stacked bar chart. You can use a stacked bar chart (horizontal) or a stacked column chart (vertical). The end result will be the same either way.

    The waffle chart is there! Well, kind of. It’s hiding behind a bunch of clutter. Let’s adjust the scale and then delete, delete, delete.

    Then, highlight your 1’s, go to the Insert tab, and select a 2D stacked bar chart.

    Adjust the vertical axis so that it stretches from 0 to 10 (rather than 0 to 12). To adjust the axis’ scale, first click on any of the numbers. For instance, you could hold your cursor directly over the 6, the 8, or the 10. You’ll see a rectangle appear around the outside of the numbers.

    Then, right-click, and select the option at the very bottom of the pop-up window, which is called Format Axis.

    Adjust the maximum bound from 12 to 10.

    Adjust the vertical axis so that it stretches from 0 to 10 (rather than 0 to 12).

    Now, the vertical axis only goes to 10—good. (Otherwise, our final product would’ve had some weird white space.)

    Now, the vertical axis only goes to 10—good.

    Delete the title, legend, and scales. Remove the border and grid lines.

    Delete the title, legend, and scales. Remove the border and grid lines.

    Reduce the gap width all the way down to 0%. This is your computer’s funny name for the space between the columns or bars. Follow my tutorial if this technique is new for you. The result is a big blob.

    Reduce the gap width all the way down to 0%. This is your computer’s funny name for the space between the columns or bars.

    Modernize your visual with light gray fills and white outlines. Can you see the waffle?!

    Modernize your blog with light gray fills and white outlines. Can you see the waffle?!

    Fill in a few shapes with your darker action color. For example, you would fill in 57 of the 100 squares to represent 57 percent of people.

    Fill in a few shapes with your darker action color. For example, you would fill in 57 of the 100 squares to represent 100 percent of people.

    Finally, make sure your graph is a square (not a rectangle). No eyeballing. Activate your graph by clicking on the outside border. Then, go to the Format tab and look for the Size section. In this example, I set my chart to be 3 inches by 3 inches. This is a nice size for Word documents. You could place two 3-by-3 waffle charts beside each other on the paper. You’ll need larger waffles for your slide deck of course.

    Finally, make sure your graph is a square (not a rectangle). No eyeballing. Activate your graph by clicking on the outside border. Then, go to the Format tab and look for the Size section. In this example, I set my chart to be 3 inches by 3 inches. This is a nice size for Word documents. You could place two 3-by-3 waffle charts beside each other on the paper.

    Bonus


    Purchase the template ($5)

    Have you used these stacked-bars-disguised-as-waffles in your own work? If so, please link to your document in the comments.

    More about Ann K. Emery
    Ann K. Emery is a sought-after speaker who is determined to get your data out of spreadsheets and into stakeholders’ hands. Each year, she leads more than 100 workshops, webinars, and keynotes for thousands of people around the globe. Her design consultancy also overhauls graphs, publications, and slideshows with the goal of making technical information easier to understand for non-technical audiences.

    14 Comments

  • Nick says:

    Love waffle charts and have been using them a lot lately! Great alternative to the Pie! I found this link as well. It was a bit of work on the front-end, but then made it helpful to be able to save the doc and enter my % for new charts without having to manually fill in the bar colors each time. http://datapigtechnologies.com/blog/index.php/building-waffle-charts-in-excel/

    • Ann K. Emery says:

      I don’t think I’m patient enough to follow that tutorial…. In real life, I use conditional formatting, which is the demo shown in the 1-minute video at the end of this post. But in real life I also primarily work with non-data people who love the simplicity of building a waffle from a stacked bar chart, hence this blog post. I love that there are workarounds for anything and everything.

  • Molly says:

    Hi Ann. Thanks for the post. I was able to replicate your first waffle chart. Is the waffle chart with the v lookups, drop downs and conditional formatting for purchase?

  • Andy Ferguson says:

    Interesting approach. As an alternative, I don’t use charts at all for waffles, but do it all in cells with formulae and conditional formatting. Using the same range as your example, enter in cell A10
    =(COLUMNS($A:A)+((ROWS(10:$10)-1)*10)<=$K$1)*1
    Copy across and up to J1
    Square up the cells, shade them light grey and add a white border. Make the font colour light grey as well.
    Use conditional formatting to make background and font the chosen highlight colour if cell value = 1
    Enter any number from 1-100 in cell K1

    • Ann K. Emery says:

      Conditional formatting is gamechanging, isn’t it? I usually teach the beginner to make waffles with Insert –> Shape, teach the intermediates to make waffles with stacked bars, and teach the advanced folks to make waffles with conditional formatting. Let me know if you have a spreadsheet/blog/tutorial describing your approach in more detail. I’d be curious to explore it.

  • David Osman says:

    Ann, do you have any tips on labeling the areas in your waffle chart? I see that you do some labeling through the title.

    • Andy Ferguson says:

      You could use overlaid text boxes with “No fill” to make them transparent and a formula that drives the label – something like
      =A1&” of “&”A2&”people agreed that they wanted to share their own story”
      You would need to have that in a cell, and the formula in the text box being just a cell reference, and you wouldn’t be able to replicate Ann’s mid-sentence format change (without going to multiple text boxes), but it would be dynamic.

  • Andy Ferguson says:

    Ann – that beginner / intermediate / advanced split is interesting personally, as my perception is different, probably due to my own preconceptions! I might write something up and send it across (I’m no blogger) if I get a chance.

  • Ann K. Emery says:

    Here’s a real-life example of waffle charts: https://www.bloomberg.com/news/articles/2017-10-17/smartphones-are-killing-americans-but-nobody-s-counting Scroll down to the “Fewer Than One in Seventy Road Fatalities Are Officially Linked to Cell Phone Use” section. I’ve got more examples at http://annkemery.com/portfolio/waffle/ to inspire you, too.

  • A detailed Explanation of a Waffle Chart. Many a times i don’t see people preferring waffle charts though its a good way of data representation.

  • Gloria says:

    Thanks Ann

  • Genius says:

    Thank you for imparting knowledge, this will really help me a lot when presenting data. I am not sure if I overlooked it or something, however, can you share with us the steps how to create a 3-product waffle chart? Thank you.

    • Ann K. Emery says:

      You can copy and paste your original chart… make a few tweaks… and then “group” all the charts together for an easy transfer from Excel into another program like Word or PowerPoint. Much faster than starting from scratch!

  • Leave a Reply to Ann K. Emery Cancel reply

    Your email address will not be published. Required fields are marked *

    You Might Like

    Our complimentary mini course for beginners to dataviz. Takes 45 minutes to complete.

    Enroll

    How to Bring Your Technical Tables to Life

    Just because I’m pro-graph, I’m not anti-table. Technical tables have so much value, especially as visual appendices for reports. In this blog post, you’ll get ideas for bringing your technical tables to life.

    More »

    Need practical how-to tips? In this course, you’ll learn how to make great graphs inside software you already have. Includes beginner, intermediate, and advanced tutorials for making charts from start to finish.

    Enroll

    Subscribe

    Not another fluffy newsletter. Get actionable tips, videos and strategies from Ann in your inbox.