
A few weeks ago I was invited to speak at Chicago’s Harris Theater – definitely one of the coolest places I’ve ever explored in Chicago! The attendees specialized in all different aspects of the performing arts – writing grants, collecting data to demonstrate how their organization is reaching outcomes, monitoring their group’s performance, and so on. During the chart-choosing segment of the workshop, we thought about different ways of displaying fictional ticket sales data.
In this example, I’m pretending that one of the performing arts groups is tracking how many tickets they’ve sold online, over the phone, and at their in-person box office for an upcoming show:

I write about chart-choosing and sketching a lot and wanted to share these ideas with you, too.
Sketching goes like this:
You grab your already-tallied data table, like the one shown above. You’ve already done a little number-crunching, simple stuff like sums and averages.
Then, you set your cell phone’s timer for 15 minutes.
And you step away from your computer.
Your job is to draw all the different versions of this dataset before you sit down to your computer. Draw, draw, draw. Aim for 5, 10, or 15 different types of graphs. The more you learn about data visualization, the more versions you’ll be able to draw. What would your dataset look like as a bar chart? As a stacked bar chart? A line graph? A pie chart? A tree map? I advise workshop participants to even draw the bad graphs, the really bad stuff, like 3D exploding pie charts, if it’s on their mind and taking up precious mental space. Get those thoughts out of your mind and onto the paper. Put a big X through the awful graphs if you need to.
Once your rough sketching is complete, take your drafts down the hall to your coworker. Think aloud. Talk about how this graph emphasizes this one thing, and that graph highlights that other thing. What’s the message your team is going for? Which graph matches that message the closest? Sometimes you know your message ahead of time; other times, you fine-tune your message during this sketching process.
And finally, I give you permission to return to the computer and make the most promising graph in your software program of choice. If you design graphs on your computer before sketching on paper, I guarantee that you’ll overlook a few options. You’ll be boxed-in by the software program’s limited chart gallery. Explore everything on paper first and figure out the software later.
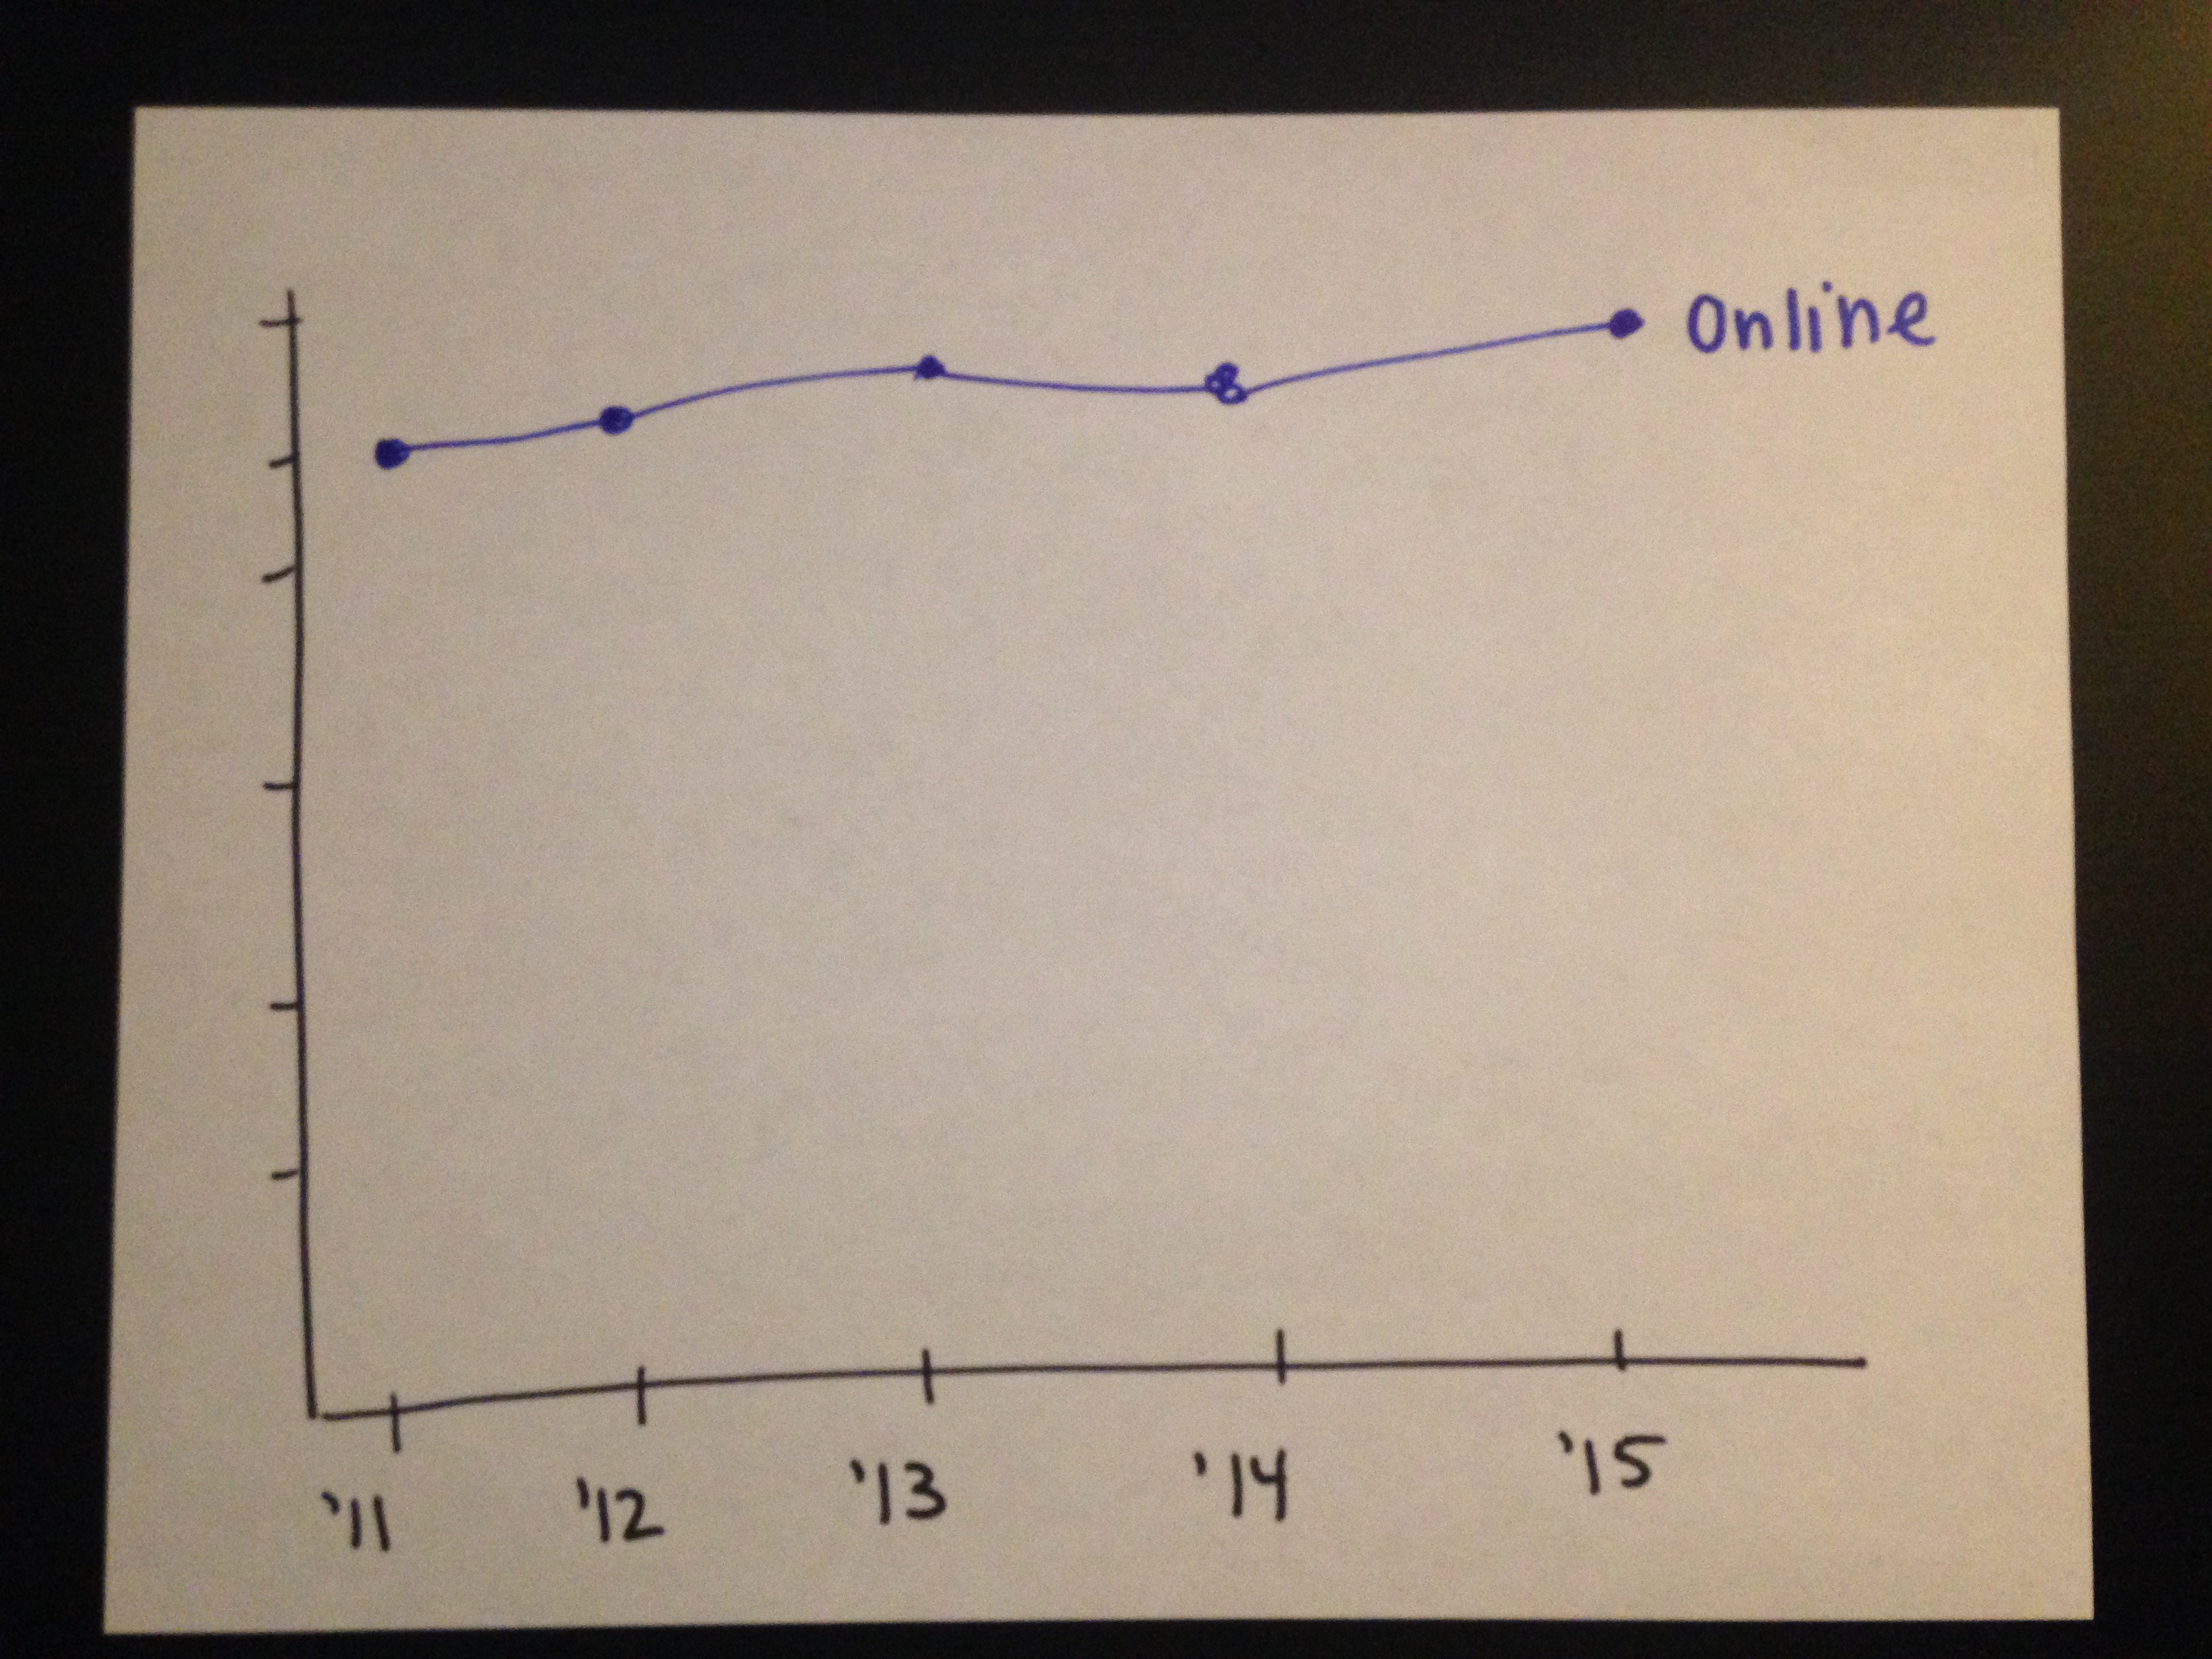
Sketch 1: A Line Graph
Here’s what my sketches looked like. I’m starting with the most basic sketch: a regular ol’ line graph that just focuses on online ticket sales. When I draw, I often go through my data table methodically, often starting with just the first row of data — online sales — and peeking at the shape of those numbers. And what did I see? A tall, flat line.
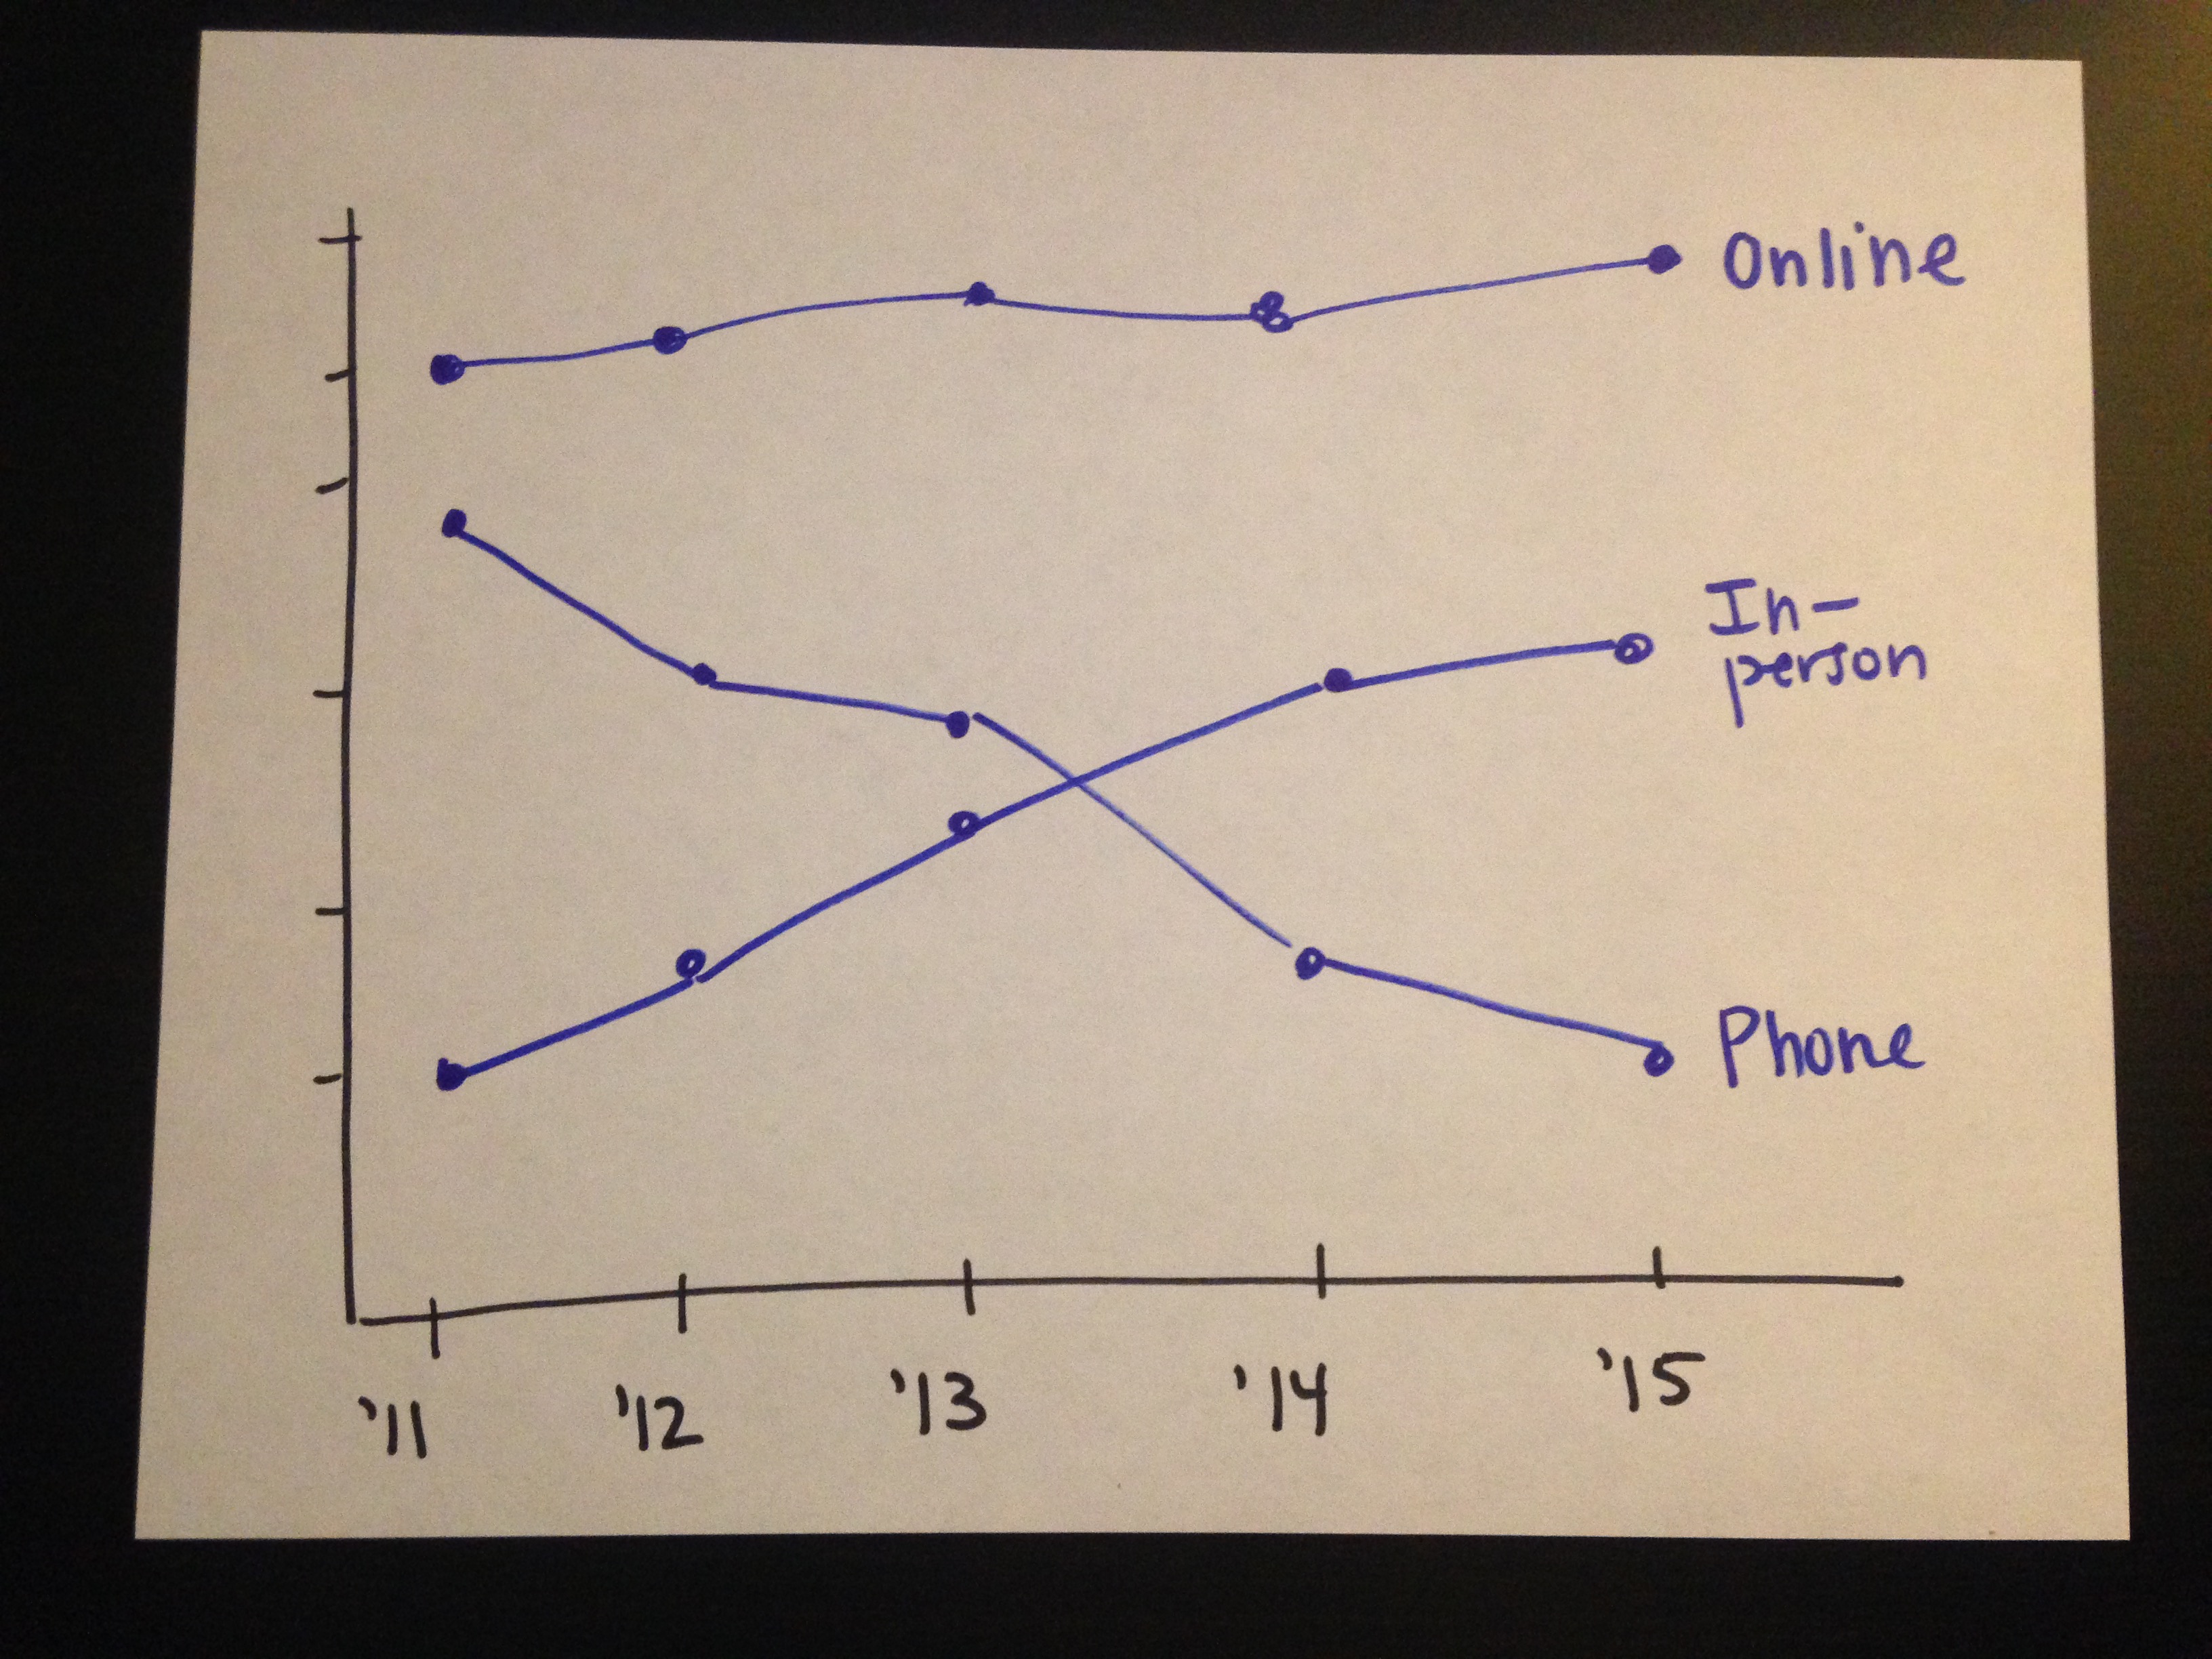
Sketch 2: More Line Graphs
Once I’ve got a handle on the first row in the table, I might add the second row, the third row, and so on, so that my brain can compare the categories to each other one at a time. Here’s another regular ol’ line graph that shows all three ticket sales types together. More contextual data = more background information available for decision-making thought processes.
Sketch 3: A Slope Graph
Or, how about a slope graph for those audiences that don’t need to see all the peaks and valleys? Some people just want to see the big-picture, starting-and-ending points. The higher-ups, like donors and some supervisors, might fall into this category. I’m pretending that a supervisor knocked on my door and said, Hey, how are we doing this year? And what about five years ago, when we launched that new sales strategy? Slope graphs cut to the chase and make before/after comparisons easy.

Sketch 4: A Bar Chart
If we’re aiming for big-picture findings, how about a bar chart that only displays the five-year sums? We could ignore the year-by-year numbers and only display the total sales numbers.

Sketch 5: Small Multiples Line Graph
Returning to the multi-year version again… This fictional dataset is semi-spaghetti, meaning that the three lines started to intersect a little when they were all displayed in the same graph. Not so crowded that the criss-crossing gets in the way of interpreting the data, but, borderline. If your real dataset gets too zig-zaggy and criss-crossy, try breaking the single graph into three separate graphs with a small multiples layout.
Small multiples graphs let my brain interpret the graph piecemeal. I can check out the online sales and think about the implications of that pattern. Then, I shift my gaze a couple inches to the right and check out the phone sales. Finally, I shift my gaze to the right a bit more and examine the in-person box office sales. The layout guides my attention through the graph slowly, rather than overwhelming me by throwing all three lines on the page at once. I see the online, phone, and in-person patterns both individually and as a whole.

Sketch 6: Small Multiples Line Graph that Compares Actual Numbers with a Goal
At this point in the sketching process, I began daydreaming about having a more interesting dataset and wishing that I would’ve included goal sales numbers alongside those actual ticket sales numbers. A target line might be dotted and/or in a lighter color to add much-needed context.

Sketch 7: Stacked Columns
Or, maybe the viewers need to see part-to-whole patterns in a stacked column chart. I transformed my table’s counts into percentages to see what proportion of tickets were sold online, over the phone, or in-person. The five-year total would be nudged to the right a bit.

Sketch 8: A Pie Chart
Finally, a sketch that’ll make the purists cringe, a pie chart. Don’t worry, I teach my workshop participants about alternatives to pie charts. I might use a pie chart when I want my fictional viewers to see the part-to-whole comparisons. I’d use a darker color to draw their eyes towards one slice and add a sentence or two beside the chart to make sure their attention stays focused on that same slice.

One dataset, many correct options.

Did you come up with additional sketches? Comment and let me know.
9 Comments
This is superb, Ann. Thank you SO much for pulling this all together in one, concise blog post. This is definitely a print-out keeper for me. I love your process, I love your results, and I especially love your non-judgmental attitude.
Kathleen – this is one of my favorite compliments of all time. Thank you.
Ann, this is great. I love the idea of making sketches to remove the constraints of the software. I teach courses to my clients on Data Vis, but never thought to have them make a hand sketch first. I will now incorporate this into my training and credit you.
[…] In my prior post, I sketched a few options for a performing arts organization’s fictional ticket sales data: […]
Love your blog Ann and especially like this post. I have read some quicker reads like Back of the Napkin by Dan Roam and Presentation Zen by Garr Reynolds and this post speaks to both! It is a valuable exercise to work in “analog” before jumping into our digital tools. When I was in college (a long time ago) I was an avid flash card user and have tried to instill that into my kids. I think the process of physically writing out ideas, thoughts…. CHARTS is a great way to stimulate the mind differently than via a keyboard. Keep it up – are you hiring? : )
Hi Ann. Great post! I really like the idea of getting away from the software and sketching out what we really want to discover whether it be charts or data model design.
Cheers,
Kevin Lehrbass
Hi Ann, It is a great sharing. I am working as a business analyst and usually I need to design and create dashboard but I seldom make sketches before I start doing the work with the software like PowerBI. My way is to make the sketches on PowerBI directly and select which one is better. So I skip the step to discuss the sketch with my colleagues. I am very bad at making a paper work that’s why I like to make the sketch on computer. Do you suggest me still try to make sketches on paper before starting working on the software? Thanks for your advice.
Hi Johan, Yep, I still suggest sketching on paper first.
Love this work. Thank you for showing it. I do a lot of hand sketch work, especially on whiteboards during meetings. Although now, I tend to use a Wacom Sketchpad Pro in virtual meetings. Or is flip my camera around and draw on paper on the desktop using felt tip pens.
I use GIMP to clean up images. It takes less than 2 minutes for an image. I cleaned up a couple of yours if you’d like to see the results.
I pretty often take them into Inkscape, convert them to vector, and replace my hand written text with a handwritten font. I can then move parts around, combine different parts into a single drawing, and publish then as SVG or copy them into PPT.