Have a list of words that need some alphabetizing? Have a list of numbers that you want to arrange from least to greatest or greatest to least? Rather than painstakingly rearranging your rows by hand, let Excel’s Sorting and Filtering features do the heavy lifting for you.
How to Sort Data
Most folks are familiar with Excel’s Sorting feature. (And if not, you’re going to love it!) The Sort button is located within your Data tab.
Instructions:
- Highlight or select the data that you want to re-order.
- Go to the Data tab.
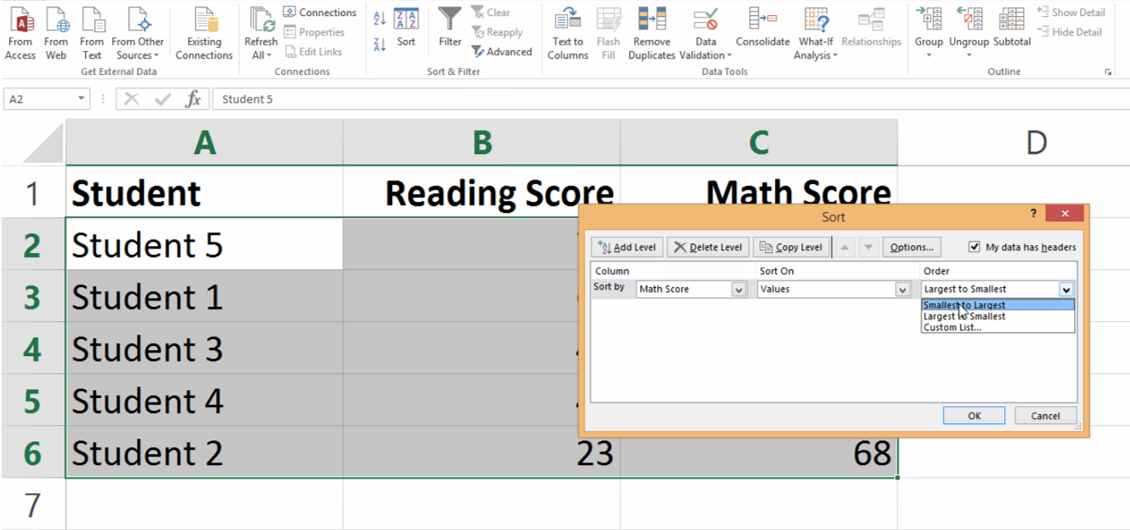
- Select the Sort icon.
- In the pop-up window, choose how you want to organize your data, e.g., alphabetically or from greatest to least.
Bonus! You can also create multiple layers of sorting by clicking the Add Level button within that same pop-up window. For example, you might first sort by gender and then by age.
How to Filter Data
Have you seen the Excel’s Filters option yet? It’s hiding within plain sight on the Home tab. Filters are one of my all-time favorite features of Excel because, for me, they’re even easier to use than sorting, and they save valuable time as I’m wading through so many numbers.
Instructions:
- Highlight or select the top row of data (or whichever row has your labels in it – it might be the second or third row if you’ve got any empty space at the top of your spreadsheet).
- Go to the Home tab.
- Click on the Sort & Filter button and then select Filter.
- Tiny boxes with tiny arrows will appear on each of the cells in the top row of your dataset. Congratulations, you’ve got filters!
- Click on the arrows to sort the data from smallest to largest or largest to smallest, to sort from A to Z or from Z to A. Or, use the checkboxes to filter the data. For example, you might only want to look at males, or only at females. The filtered-out data hasn’t been deleted and you can make it reappear at any time by simply re-checking the filter’s checkbox.
Bonus! Use your new filters to arrange your dataset by colors. Sometimes I use red, yellow, or green colors to indicate whether items are high, medium, or low priorities for me. I can filter my dataset so that the reds appear on top, followed by the yellows, followed by the greens.
Leave a Reply