Ready to fine-tune your tables?
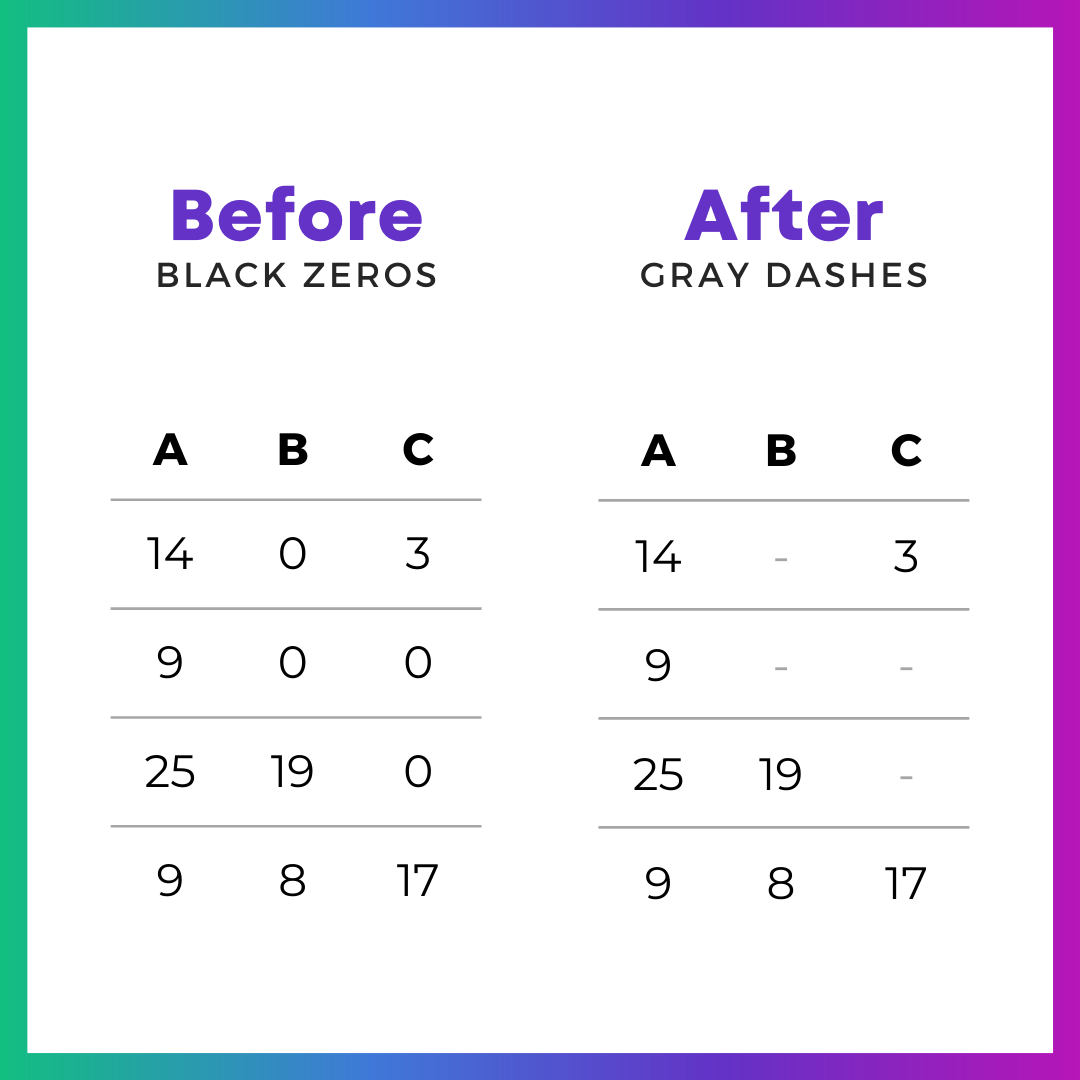
Here’s one of my favorite table decluttering tips: Change the black zeros into gray dashes—with formulas and conditional formatting.
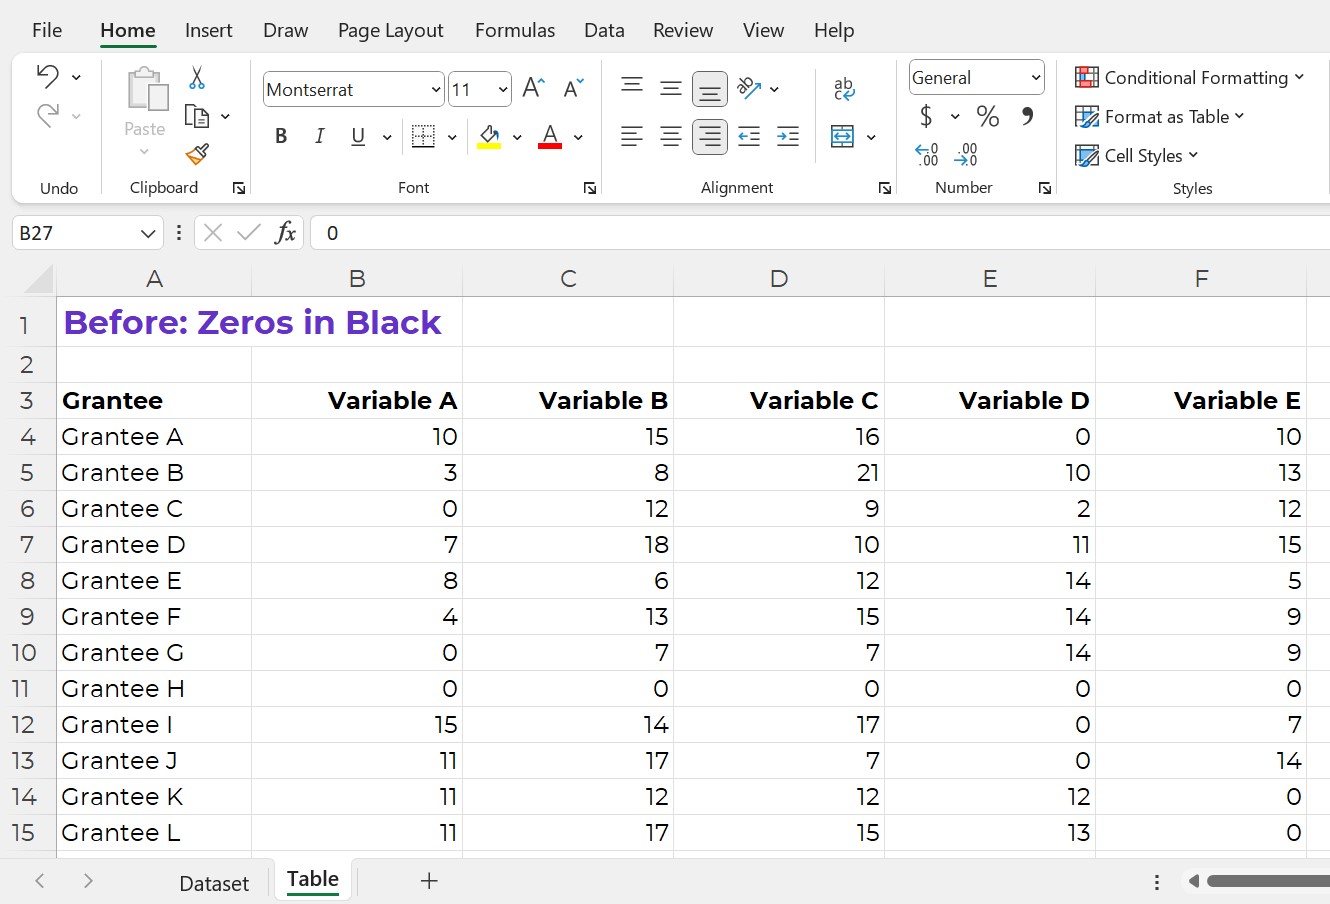
Before: Zeros in Black
Does your table have lots of zeros?
Sometimes my tables have huge values—numbers, percentages, or currency into the thousands, millions, or even billions.
Other times, my tables have small values—lots of single digit and double digit numbers, and even some zeros, like this one.
I recently worked on a dashboard project with a foundation where our n was just 11 grantees. It was the smallest n I’d worked with in a while!
This table is fictional, but you get the idea.
Here’s the old way to show zeros: In black text.
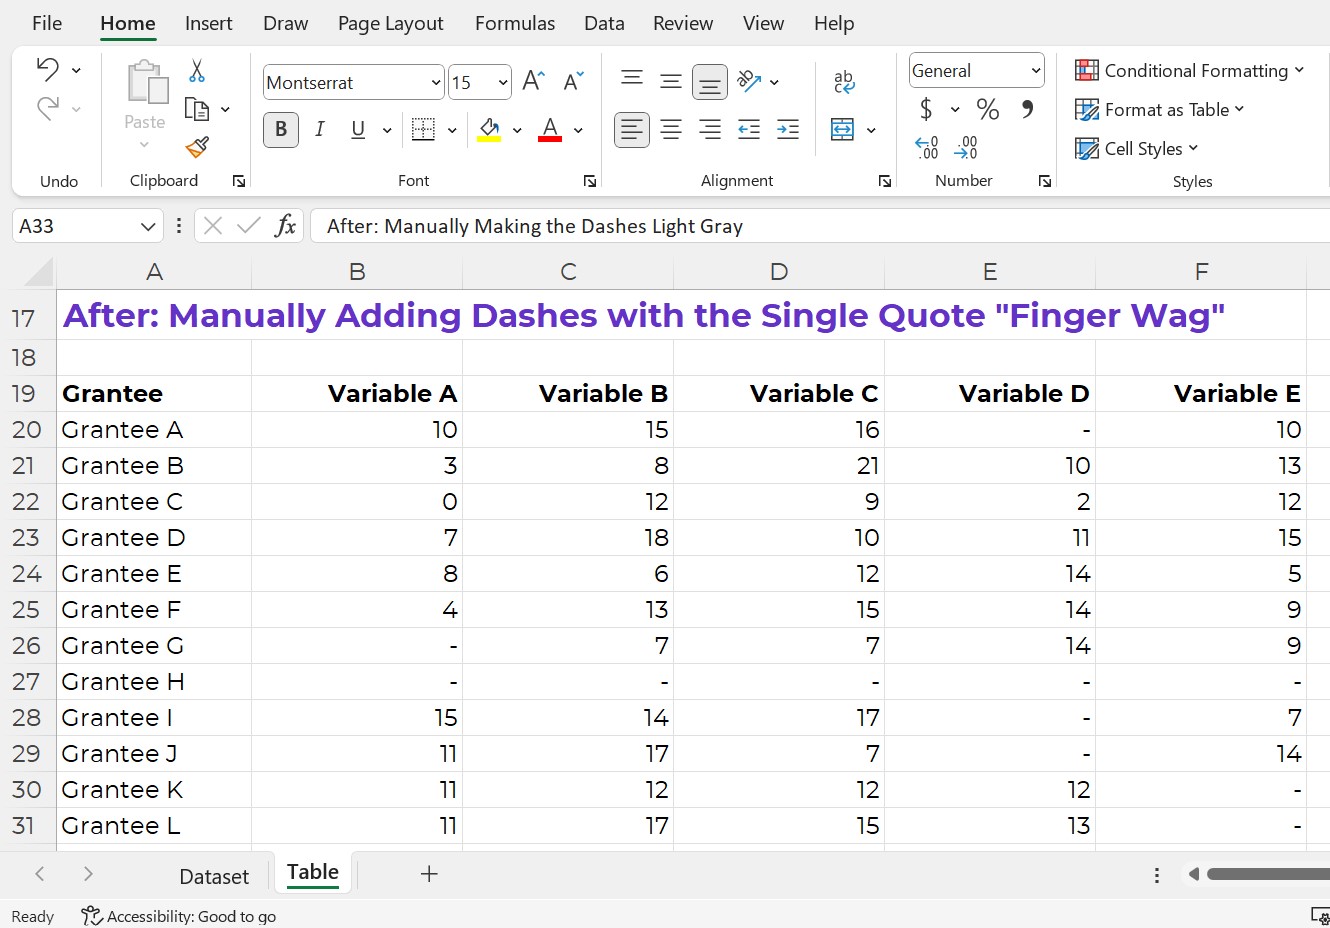
After: Manually Adding Dashes with the Single Quote “Finger Wag”
Let’s replace the 0s with dashes.
In Excel, here’s how:
- If you type a dash, Excel will get confused. Excel thinks we’re creating a subtraction formula.
- Instead, start with a single quote, a.k.a. the Finger Wag. We’re scolding Excel. The single quote means, “Don’t change my format! Leave whatever I type after the single quote alone! This isn’t supposed to be a subtraction formula! It’s just a dash!”
The finished product would look like this (below).
Now, we can actually see the zeros better!
It’s easier to see that Grantee H had an entire row of zeros. Variables D and E also had more zeros than the other variables.
After: Manually Making the Dashes Light Gray
Let’s keep going.
I usually make the dashes gray (so they disappear even more).
You can simply change the font color.
After: Automatically Adding Dashes with an IF Statement
But what if your tables values come from another source? (So there are formulas living behind the scenes?) In that case, we can’t simply type a dash by hand. It would remove the formula.
In this example, I’m pretending we’ve got a separate dataset on its own sheet.
The table is a sum of all those entries.
My tables often have sumifs, countifs, xlookups, and more living behind the scenes, like this:
We can adjust our existing formulas just a tad.
I add IF statements so that if my formula results in a zero, then it shows a dash:
After: Automatically Making Dashes Gray with Conditional Formatting
Finally, let’s add another time-saver.
Let’s use Conditional Formatting to automatically turn the dashes gray.
The fewer manual changes, the better!
Formulas and Conditional Formatting save our future selves a lot of time. If we add new entries to our dataset, then the formulas will automatically update.
Formulas and Conditional Formatting also reduce typos. We won’t accidentally forget about one of the zeros.
Here’s how:
- Highlight the table.
- Go to the Home tab.
- Click on the Conditional Formatting button.
- Choose Highlight Cells Rules.
- Choose Text That Contains.
- In the pop-up window, type a dash.
- Instead of “Light Red Fill with Dark Red Text,” go to the bottom of the drop-down list, and choose Custom Format.
- On the next pop-up window, change the font color to gray.
That sounds like a lot of steps, but it’s fast, I promise!
Once you get familiar with Conditional Formatting, it only takes this long:
Yes, You Can Transfer Formatted Tables from Excel into PowerPoint or Word
Here’s how you’ll transfer your table into Word:
- In Excel, finish formatting the table. I added gray lines between the rows and I “hid” the grid lines from the cells (View tab –> uncheck the Gridlines box. Sure, you can adjust the borders later in Word, but table formatting is generally a pain in Word. I try to do 99.9% of the formatting in Excel.
- In Excel, I highlighted and copied the table with good ol’ CTRL + C.
- In Word, I went to Paste –> the down-arrow–> Keep Source Formatting.
- Then, in Word, I re-sized the table to fit the page.
It looks like this:
Here’s how you’ll transfer your table into PowerPoint:
- In Excel, finish formatting the table. I added gray lines between the rows; I “hid” the grid lines from the cells (View tab –> uncheck the Gridlines box); and I re-sized the columns (wider) and rows (taller). Sure, you can adjust these things in PowerPoint later… but it’s such a pain. I prefer formatting in Excel first, and then transferring to PowerPoint.
- In Excel, I highlighted and copied the table with good ol’ CTRL + C.
- In PowerPoint, I went to Paste –> the down-arrow –> Keep Source Formatting.
- Then, in PowerPoint, increase the font size. I recommend 18+ for presentations.
Please don’t take screenshots from Excel and paste them into other programs. Your table will get blurry.
Please don’t transfer tables and graphs as images. They’ll get blurry.
Please don’t take screenshots from Excel and paste them into other programs. They’ll be blurry.
Please don’t transfer tables and graphs as images. They’ll be blurry.
Download the Spreadsheet
If you’re familiar with sumifs, if, and Conditional Formatting, then this will be fast and easy for you!
If you’re new to sumifs, if, and Conditional Formatting, then download my spreadsheet. You can click through the formulas yourself to see how everything is set up: https://depictdatastudio.gumroad.com/l/UseGrayDashesInsteadOfZeros
Leave a Reply