
Data visualization is more about strategic thinking than about following steadfast rules.
Take a simple line graph, for example.
How will you label your line graph?
With vertical axis labels and light gray grid lines? With labels directly above or on top of the data points? A mix of both?
Here are four styles to consider.
Option A: Label the vertical axis
The first option is to simply label your vertical y-axis: 0, 25, 50, 75, 100, and so on.
The trick is strike a balance between labeling too frequently and not frequently enough. In this fictional scenario, I used increments of 25. The increments you choose will likely depend on your unique dataset.
Then, lighten (mute) the grid lines. Thin gray lines > thick black lines. We need our viewers to focus on the star of the show — the burgundy and orange lines — and not get sidetracked by the backup dancers — the supplemental information like grid lines and tick marks.
I use this style when I want viewers to focus on the general, big-picture view. Is the line generally going up or going down? Where are the peaks and valleys over time?
The viewers won’t see the exact values. In other words, my spreadsheet will tell me that Organization A had a 130 in 2009. But my viewers can only estimate that value.
The viewers’ takeaway message might be, “Organization A’s values are always above Organization B’s values. Both organizations have higher numbers in 2015 compared to 2009. Organization A started around 125 and went up to the 175-200 range, and Organization B started in the 25-50 range, got as high as the 100-125 range, but then went back down to the 75-100 range. And what the heck happened to Organization B between 2014 and 2015?”

Sometimes I add markers (those little circles on top of the lines).
I include markers when I want my viewers to remember that each point represents a different point in time. Rather than the smoothed-out appearance in the line above, this style subtly emphasizes that there gains and losses over time. Make sure your markers are relatively small; otherwise, the graph can look outdated and clunky.

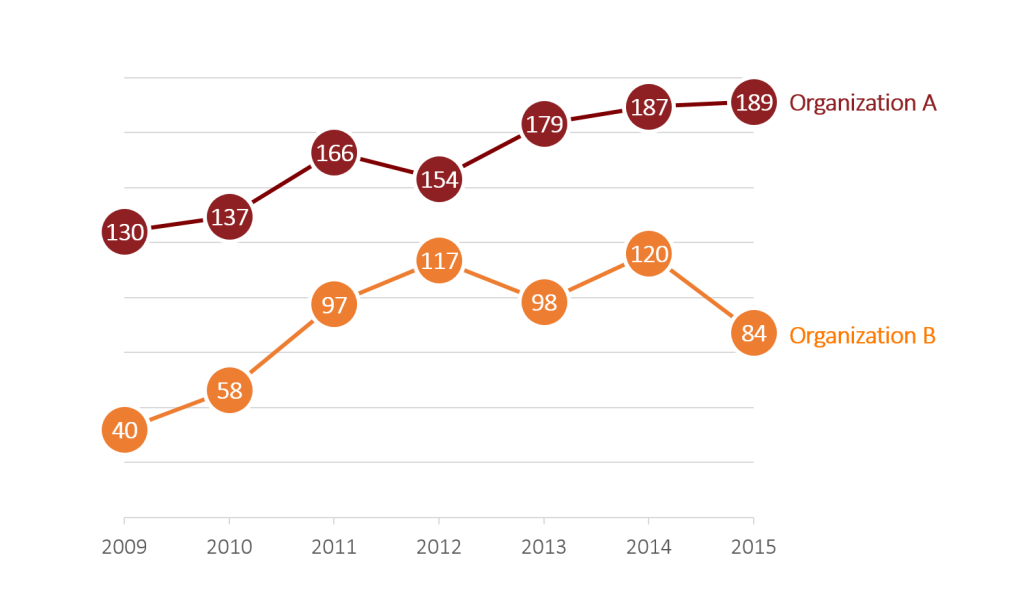
Option B: Label all of the data points directly

A second option is to remove the axis and label the data points directly.
Direct labeling means placing the labels as close to the data as possible. In this case, the numeric labels go right above, or on top of, the data points. We’re aiming for physical proximity.
You might choose to place the labels directly above the lines. However, this style tends to get a bit cluttered, especially when there are more than two lines per graph, or if you have lots of points in time to display.

To avoid some clutter, I often center the numeric labels directly on top of each data point:

Or, you might center the numeric labels directly on top of circular markers.
Meh.
The circles need to be pretty large to fit two-digit and three-digit labels. And if my labels included percentage signs, then the circles would need to be even larger.
This style gets clunky fast. It reminds me of something I would draw in elementary school. Feel free to disagree… I don’t have research to back this up. It’s just my personal aesthetic preference.
Option C: Label both the vertical axis and data points
No, no, no, no, no, no, no, no, no, no, no, no, no, no, no, no, no, no, no, no, no, no, no, no, no, no, no, no, no, no, no, no, no, no, no, no, no, no, no, no, no, no, no, no, no, no, no, no, no, no, no, no, no, no, no, no.
This style is overkill. Information overload. Super cluttered.
Axis labels help viewers estimate the numbers. Data labels help viewers see the exact numbers. Do your viewers need estimates or exact numbers? Put on your thinking cap and choose one or the other.
Label the axes, or the data points, but not both.
This chart would score poorly on the Labels Are Used Sparingly section of the Data Visualization Checklist.


Option D: Label just a couple points along the line
Finally, a fourth option is to only label a few points along the line.
You might label the beginning and end points. Or, you might label a specific year or two. For example, you might be telling a story about what happened in 2012 specifically. If so, you could label the 2012 point only.
This style helps you avoid information overload and is often preferred among laypeople viewers who want the big-picture, birds-eye-view of information. If your viewers are researchers or data scientists who love seeing alllll the raw data, I wouldn’t recommend this style.
You might forego the vertical axis labels:

Or, you might include the vertical axis labels:

Which styles do you use most often? Which styles do you prefer?
5 Comments
I like the fact that you ended your post with a question: Which do you prefer? Because, although some options are obviously BAD (i.e., too cluttered to make heads or tails out of), among other options, there could be several choices that work depending, of course, on your purpose, but also on just what appeals to you aesthetically, as you pointed out.
Thank you for sharing your thoughts and your work. It really helps to have you tease apart the different components.
Great walkthrough of these ideas. The best answer is audience. The only reason for graphs and not columns of numbers if if the graphs can communicate an objective better, which is often not the case. So what is facilitated by adding the graphic metaphor (in this case of spatial distance to stand in for a contracting and then expanding difference)? Which of the options facilitates that best? I’d argue that data labels like the last image, but with ’09 added, would help tell the clearest story here.
I never thought of centering the numeric data labels over the data point on a line chart – love it! I’m totally guilty of often using Option C. I will have to work on that.
Thanks for sharing!
Fantastic article and highly practical. Thank you.
[…] recently discussed four options for labeling line graphs. A personal favorite is to place the labels directly on top of the data points, like […]