
Want to design reports that actually inform decisions? With software you already have??
Nobody wants to pour blood, sweat, and tears into a document that sits on a dusty shelf.
In May 2021, I co-presented with Elizabeth Grim at the Eastern Evaluation Research Society’s annual conference.
Our session was titled, “How to Design Reports that Actually Inform Decisions with Software We Already Have.”
Attendees learned about:
- The 30-3-1 approach to reporting with unlimited visual appendices
- Adding a 20-minute report cover
- Adding color-coded divider pages
- Aiming for 1+ visual on every single page
- Including a variety of visuals
- Using inclusive, non-violent language
Today, let’s focus on one of those techniques: following the 30-3-1 approach to reporting, which is the bare minimum for designing useful reports.
Watch the 10-Minute Tutorial
I recorded a portion of our presentation for you. Here’s a 10-minute lesson about the 30-3-1 approach.
Hopefully you recognize this technique already; I’ve been speaking about it on panels for a decade. 😊
I’ve raised the bar over the past decade though. I used to simply encourage us to follow 30-3-1. I’ve clarified my advice to add visual appendices, too.
The Old Way: The 100-Page Technical Report
In the video, I show you the old way of writing reports in research and evaluation settings.
The single, 100-page technical report used to be the norm. And in some settings, it still is. (I’m thinking of the government agencies and government contractors that I work with.)
Nobody’s got time to read all 100 pages. I think we’ve known that for a while. 30-3-1 to the rescue!
The 30-3-1 Approach
Don’t want your reports to sit on a dusty shelf?
At a bare minimum, I suggest following the 30-3-1 approach, which includes:
- A 30-page report (30 pages maximum) with unlimited visual appendices
- A separate 3-page PDF
- A separate 1-page PDF
In a perfect world, with more time and a bigger budget, I’d love to see slideshows, dashboards, and infographics for every single project, too.
Reports are a good starting point.
The 30-3-1 approach with unlimited visual appendices is even better.
And adding slideshows, dashboards, and infographics is even better.
This approach is all about tailoring for our audiences. Rather than pouring everything into a single document, we design a 30-pager with one audience in mind, a 3-pager with another audience in mind, and so on.
Paring Down 100 Pages into 30 Pages or Less
This is the hardest step. You’ll need to get input from your boss, your report’s audience, a stakeholder group, etc.
I suggest following Marie Kondo’s advice: Focus on what you’re keeping, not on what you’re letting go of. In the video, I discuss her technique for decluttering our closets: Make a big pile of all your clothes, and then look at each item to decide what sparks joy.
We focus our mental energy on the best pieces that are worth keeping, rather than getting stressed by what we’re discarding.
We can apply the same strategy to paring down reports. Focus on the charts, pages, or chapters that are so valuable that they need to stay within the 30-page report body.
We don’t have to delete the rest of the pages. We simply move them to the back of the report, and they form the appendices.
The 3-Pager and 1-Pager
When we’re done with the 30-page report, we also need a separate 3-page report and a separate 1-page report.
Sometimes we’re tempted to count the executive summary as the 3-pager or 1-pager. That’s not enough!!! I recommend creating separate PDFs altogether.
And of course, we don’t have to follow the 30-3-1 approach exactly. We’re aiming for a full version, a mid-length version, and a short-n-sweet version. Your 3-pager might actually be 5 pages, for example. The spirit of the 30-3-1 approach is still there. I want us to avoid only writing a 100-page technical report. 20-10-2 or 30-5-2 will still help our readers tremendously.
A Case Study from a Public Health Agency
In the video, I mentioned a guest blog post from Sara DeLong about how the Wisconsin Division of Public Health applied this technique.
Her agency developed a 130-page report, a 10-page summary, and a 1-page summary. Then, they also created videos, images, and billboards (!!!) to ensure that the messages got off the dusty shelf and into the community.

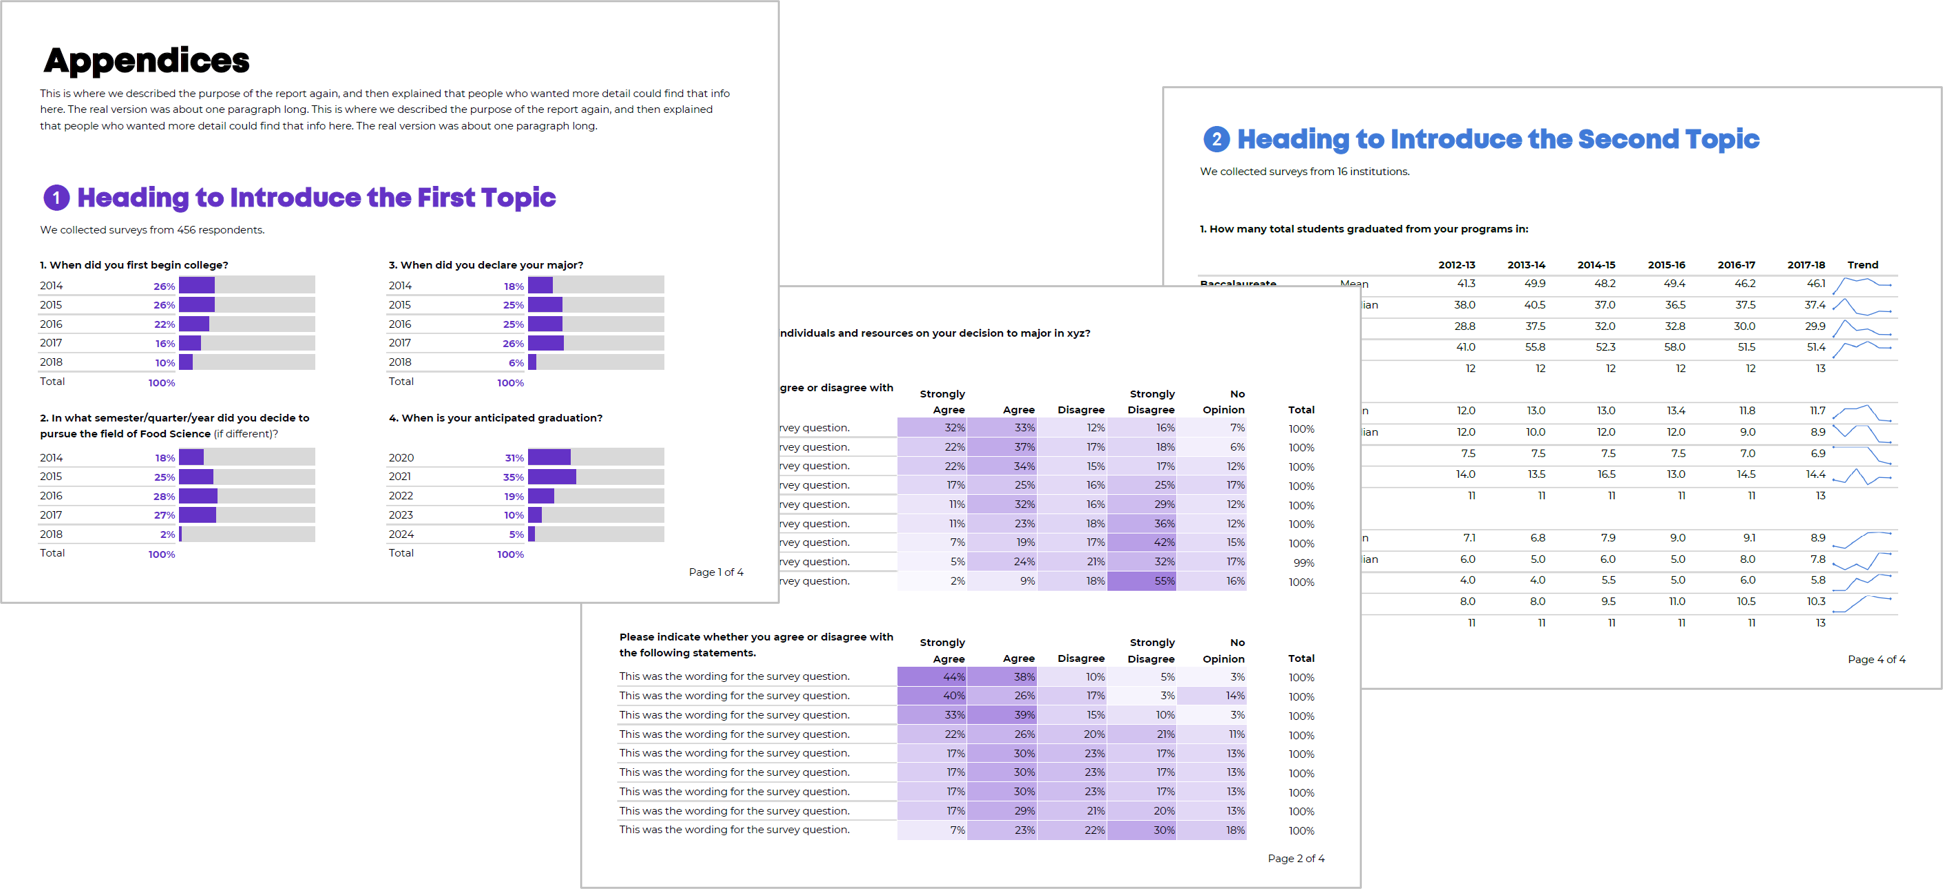
Add Unlimited Visual Appendices
In the video, I also discussed adding unlimited visual appendices to the end of our reports.
Here’s the blog post where you can learn about visual appendices and get tips for creating them yourself.
Spoiler alert: I create these tables in Excel; add Data Bars, Color Scales, and Spark Lines; and then save them as PDFs.
Learn More
My co-presenter, Elizabeth Grim, also wrote a conference session recap.
Your Turn
Have you followed 30-3-1? Have you created unlimited visual appendices? Please comment below and link to your public-facing examples or describe your project. I’d love to learn from you.
Leave a Reply