9 Comments

  • Kathleen Lynch says:

    I LOVE your idea of using a table to line up your text and your graphs. So simple and yet so brilliant!

  • […] et consultantes en visualisation de données basées aux Etats-Unis. (Blog de Ann K. Emery: annkemery.com Site de Stéphanie Evergreen : […]

  • Hi there! Super interested in this checklist!
    Has this been published anywhere?
    How did you develop it?

  • Leave a Reply

    Your email address will not be published. Required fields are marked *

    The Data Visualization Checklist

    Updated on: Oct 27th, 2016
    Data Visualization
    ,
    Stephanie Evergreen and I designed the Data Visualization Checklist in 2014 and updated it in 2016. You can use the checklist to help you assess your drafts.

    Back in 2014, Stephanie Evergreen and I launched the Data Visualization Checklist.

    In 2016, we bring you the updated version!
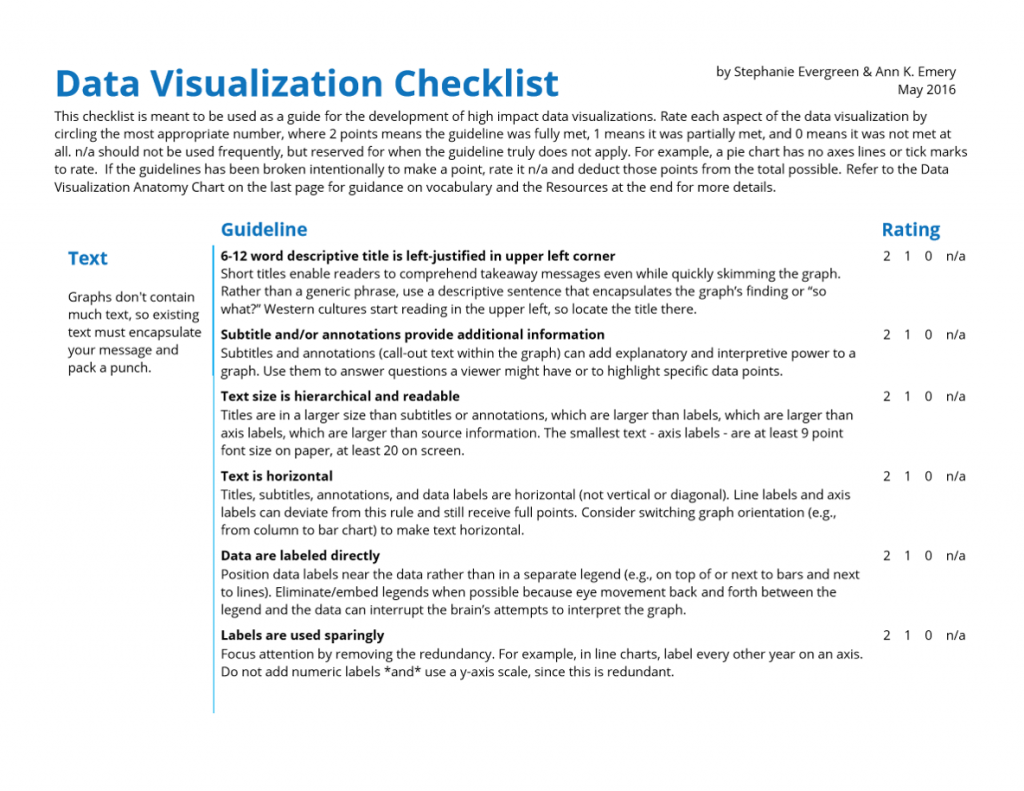
    Stephanie Evergreen and I designed the Data Visualization Checklist in 2014 and updated it in 2016. You can use the checklist to help you assess your drafts.


    Download the Data Visualization Checklist (Free)

    What’s Included?

    Stephanie and I tweaked five items:

    • Text size is hierarchical and readable
    • Labels are used sparingly
    • Proportions are accurate
    • Axes do not have unnecessary tick marks or axis lines
    • Graph has appropriate level of precision

    And I’m sure we’ll tweak more in the future. The field’s evolving and we’re learning more about the building blocks of good graphs all the time.

    Download the Data Visualization Checklist

    The revised Data Visualization Checklist is your framework for best practices. Stephanie and I included the core techniques in a single document so that you’ll have all the strategies in one central place. It’s your job to customize these techniques for your viewer and your dissemination format. Add, delete, reformat, and recycle for your handouts, slideshows, and reports.

    Download the Data Visualization Checklist (Free)

    More about Ann K. Emery
    Ann K. Emery is a sought-after speaker who is determined to get your data out of spreadsheets and into stakeholders’ hands. Each year, she leads more than 100 workshops, webinars, and keynotes for thousands of people around the globe. Her design consultancy also overhauls graphs, publications, and slideshows with the goal of making technical information easier to understand for non-technical audiences.

    9 Comments

  • Kathleen Lynch says:

    I LOVE your idea of using a table to line up your text and your graphs. So simple and yet so brilliant!

  • […] et consultantes en visualisation de données basées aux Etats-Unis. (Blog de Ann K. Emery: annkemery.com Site de Stéphanie Evergreen : […]

  • Hi there! Super interested in this checklist!
    Has this been published anywhere?
    How did you develop it?

  • Leave a Reply

    Your email address will not be published. Required fields are marked *

    You Might Like

    Our complimentary mini course for beginners to dataviz. Takes 45 minutes to complete.

    Enroll

    The Data Visualization Design Process: A Step-by-Step Guide for Beginners

    Visualizing numbers in charts, graphs, dashboards, and infographics is one of the most powerful strategies for getting your numbers out of your spreadsheets and into real-world conversations. But it can be overwhelming to get started with data visualization. In this step-by-step data visualization guide for beginners, I’ll walk you through the data visualization design process so that you can transform your spreadsheets into stories.

    More »

    Inside our flagship dataviz course, you’ll learn software-agnostic skills that can (and should!) be applied to every software program. You’ll customize graphs for your audience, go beyond bar charts, and use accessible colors and text.

    Enroll

    Subscribe

    Not another fluffy newsletter. Get actionable tips, videos and strategies from Ann in your inbox.