
Does your organization collect data through online surveys or paper surveys? Do you need an easy, effective way to visualize survey results in Microsoft Excel? Surveys are one of the most common ways to collect information. In this blog post, we’ll depict how participants’ knowledge changed after participating in an educational program at a museum. Bonus: You can even download the Microsoft Excel spreadsheet and the Microsoft Word document that I used to create these data visualization makeovers.
Before: Just the Survey Questions; No Graphs Yet!
A couple weeks ago I spoke to Harvard University graduate students about visualizing survey results. This not at all to very survey scale is quite common in my research circles so I’m sharing our ideas with all of you, too.
Here are some of the survey questions that were asked before and after program participation. Don’t worry, the online survey was formatted much more beautifully than this screenshot from the Microsoft Word version of the survey!
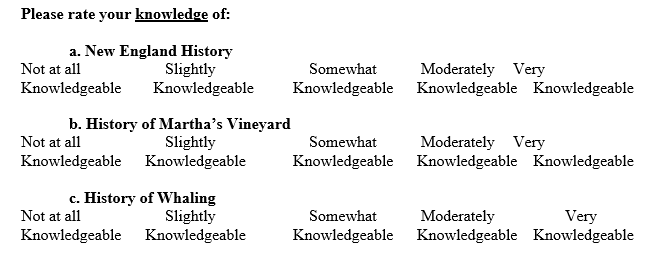
After: Stacked Columns for the Ordinal Survey Scales
I’m going to show you two makeovers. In both makeovers, I used stacked column charts to display these ordinal survey scales.
Why did I choose vertical column charts instead of horizontal bar charts? I displayed the patterns over time from left to right across the page. Before results go on the left and after results go on the right, so they get vertical columns (not horizontal rows).
Why did I display percentages instead of numbers? There were more than 100 survey responses, so I converted the raw numbers into percentages. When there are fewer than 100 responses, I display the raw numbers. It’s super confusing to talk about 16.56% of 14 people.
Why did I use three colors? I suggest that you color-code by category because it’s a great strategy for breaking up oceans of information into manageable chunks.
Why did I use different shades of each color? The very knowledgeable to not at all knowledgeable scale is ordinal so I used darker and lighter versions of each hue to correspond to the amounts of knowledge.
Why did I write titles and subtitles? I’m a visual person and prefer reading graphs over paragraphs but some viewers will prefer reading paragraphs over graphs. One of the most common mistakes I see among novices is that they focus so much on creating the graph that they forget about the paragraphs. Your viewers will benefit from having both.
Makeover 1: The Traditional Data Visualization Approach
Before you create any data visualizations, I suggest doing some upfront planning with your colleagues. You’ll want to discuss a few thought-starter questions in advance. For example, who’s your audience? Are you designing your visuals for a technical or a non-technical data audience? Are you making a slidedeck, a handout, a technical report, or some other dissemination format altogether?
Here’s the most important planning consideration in data visualization projects: Are your viewers expecting a story?
Sometimes your viewers will expect a traditional data visualization approach, in which they’ll (hopefully) read between the lines and uncover a takeaway message for themselves.
Other times, your viewers will expect a storytelling data visualization approach, in which you use a dark/light color contrast and explicit text to uncover the takeaway message for them.
Here’s the first makeover, which uses a traditional data visualization approach:

Makeover 2: The Storytelling Approach to Data Visualization
Stacked bar charts are one of the most common ways to display survey results because surveys often include scales like this one.
But, we have to be careful because one page with two points in time, three survey questions, and five options per survey question can get cluttered, fast!
In this version of the handout, I used saturation to guide the viewer’s eyes towards the very and moderate categories. In other words, those categories are dark while the other categories are light. This dark/light color contrast is called a preattentive attribute, and it’s one of the easiest strategies for telling a story with data. Your viewers don’t have to think about it or waste any of their precious mental energy. Their eyeballs are instantly drawn to the darker parts of the page.
In your project, you may choose to draw attention to the not at all knowledgeable category. There are several correct ways to guide eyes with saturation. Your job is to anticipate what your viewers will find most useful. Just use your best professional judgment.
Here’s the second makeover, which uses a storytelling data visualization approach:

Learn More about Visualizing Survey Results
In this blog post, we looked at visualizing how participants’ knowledge about historical events increased after participating in an educational program at a museum.
Here are additional resources that show you how to visualize survey results in Microsoft Excel:
- Agree/disagree scales
- Check-all-that-apply questions
- Demographic data
- Workshop satisfaction survey questions
Bonus: Download the Materials
Want to explore these graphs in more detail? Download the Microsoft Excel spreadsheet and the Microsoft Word document that I used to create these handouts.
Purchase the templates
5 Comments
Excellent point in the second makeover about using color to highlight the key message.
If you find stacked columns hard to follow because the related segments don’t start at the same baseline, you can create a small multiples style graph that places each set of segments on their own baseline. This can be created in Excel or PowerPoint as a single graph so it is easier to update or re-use. Here is an example I created for the New England History data above: http://www.thinkoutsidetheslide.com/wp-content/uploads/2017/05/SmallMultColumnsMay92017.jpg (sorry, couldn’t figure out how to paste an image in a comment).
Good to hear from you, Dave! I’ve placed stacked bar charts on the same baseline as you suggested, too. These charts are always so challenging to read so I usually push the chart’s creators/analysts to focus viewers’ attention on just a slice of the information with saturation (the second example here) or to combine a few of the categories together (a later blog post). Or, if they’re sure that every single exact category is equally important, then a table (or heat table) tends to be easier to read than a squished stacked bar chart.
I totally agree with pushing the analyst to determine what the real message is. Often, as you say, they think that every category and data point is important for the audience to see. The reality is that the audience cares about what they need to know in order to make the important decisions they are tasked with making. If we want to get this example truly focused, then we could just show the dramatic increase in the “Very” percentage from before to after and not show the other categories at all. This freaks out so many analysts because they think the audience cares as much about every data point as they do. The reality is that a decision maker sees that dramatic increase in a measurement that is important to the organization and can easily make the decision to continue to support the education initiative. When presenting the results of analysis, the primary focus should be on what the audience needs, not trying to cram every number in.
This is great Ann! I often have trouble quickly deciphering stacked bar charts. The second example is SO easy to read/understand – I’ll definitely be using this!
I’ve been stuck on a pre and post survey and have gotten all sorts of tangled in Tableau. This is the simplicity I didn’t know I needed until I saw it. Beautiful!