There’s nothing worse than presentations that drone on without a clear message. You know the feeling: You’re sitting in the audience at a conference. The speaker goes on and on. And on. And on.
Later, someone asks what you learned from the presentation. You remember some details here and there, but the big-picture concepts may not have clicked. As the presenter, I want my audience to leave with details and big-picture concepts. I need to give them a clear structure to follow and then nest those details within the bigger structure.
In this post, I’m going to share tips for visually structuring your presentation around a few key points.
Select Your Main Points and Introduce Them Early
This was one of the first slides from a recent presentation about data placemats. Veena Pankaj and I wrote an article about this process a couple years ago, so if you want to nerd-out, you can read more here.
My speaking points went like this: “I’m going to teach you a three-step process. Here’s what the process looks like at a glance. First, you analyze the data and design placemats. Second, you facilitate an interpretation meeting with a few key stakeholders. And finally, you go back to your office and use stakeholder feedback to produce the final deliverable, like a report or slideshow.
Next, we’ll go through each of these steps in more detail.”
Regardless of the length of your presentation, I suggest choosing three to five key points. Choose three to five points for a one-hour webinar, three to five points for a half-day workshop, and three to five points for a full-day workshop. You can certainly elaborate within each of those key points.

Design One Divider Slide Per Topic
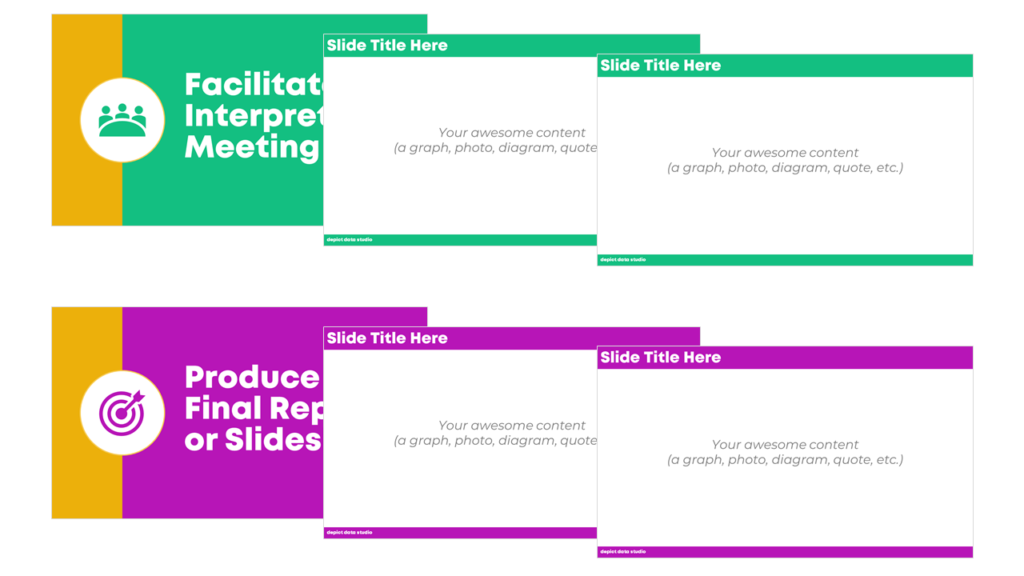
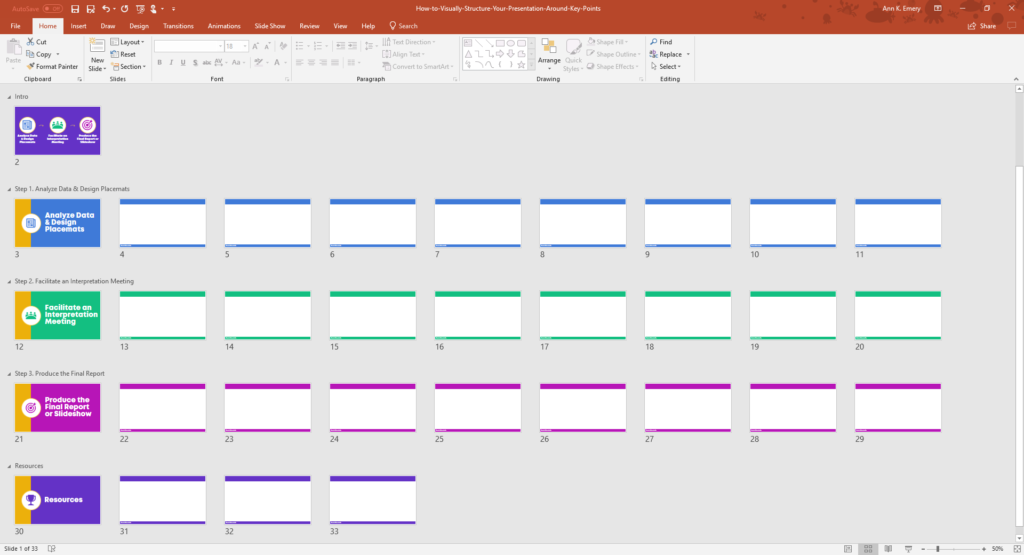
Next, make a divider slide for each of your key points. In this presentation, I made one divider slide for each of the three steps that I was teaching about: Analyze Data and Design Placemats, Facilitate an Interpretation Meeting, and Produce the Final Report or Slideshow.
Repeat the same wording, color, and icon from your earlier intro slide. Consistency is key. You’re trying to take a huge amount of information and chunk it into a few main topics. Consistency will help you get there.
I suggest using a solid background color so that the divider slides stand out. Every time your audience sees a solid color slide, they’ll know that a new topic is beginning.
In addition to this visual cue, your voice can and should also provide an auditory cue. You might say something like, “Now, let’s dive into this first step, which is to analyze data and design placemats.”

Design Body Slides
Make plenty of body slides within each chapter. You might need 5, 10, or 20 body slides depending on your presentation’s length, audience, purpose, etc. Don’t shy away from having a large number of slides! In a typical 60-minute webinar, I might have 60 slides. In a half-day or full-day workshop, I often have hundreds of slides. I break up the content into tiny slices and place one slice of information on each slide. Below, I advise you to have “a” single graph, photo, diagram, or quote per slide (not multiple graphs, photos, etc. per slide).
Repeat the same color from your divider slide. For example, the Analyze Data and Design Placemats chapter was blue, so each of the body slides in this chapter will have blue headings and blue footers.
Continue Designing the Additional Divider Slides and Body Slides
Repeat the same wording, color, and icons. Your voice will tell the audience that a new topic is beginning. The new colors will also provide a visual cue that a new topic is beginning.
Sit Back and Admire Your Clear, Effective Slideshow
Icons can make our work more memorable. Colors can signal that a new topic is beginning. Put them together, and you’ve got a memorable, easy-to-follow presentation (that looks great, too).
Bonus: Download the Materials
Want to explore how I made the divider slides? Download my slides for free. I’m using custom colors and fonts, so when you open the file on your own computer, the colors and fonts will look a little different than mine.
1 Comment
[…] few weeks ago, I showed you how to transform allllllllll of your presentation’s information into just a few main chunks. You can visually chunk information by creating divider slides and by using consistent colors and […]