I’m celebrating 100,000 YouTube views with an article on my favorite spreadsheet function: vlookup!
Vlookup is for merging and combining datasets, like when you’ve got program participants’ demographic data in one place and their scores or outcomes in another place.
I can’t tell you how many times I’ve watched researchers and evaluators waste hours of their time by trying to merge these spreadsheets manually (e.g., by copying and pasting back and forth).
You’ve got better things to do with your time, don’t you?
Vlookup to the rescue!
Vlookup is for Combining Datasets
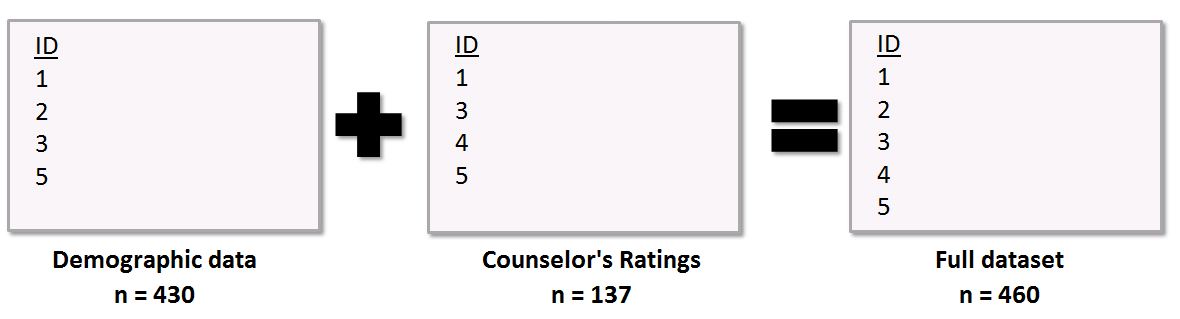
In the example below, I had demographic data for 430 people in one spreadsheet and their mental health counselors’ rating of their progress for 137 people in a second spreadsheet.
I knew I was supposed to have data for 460 people total.
I couldn’t simply copy and paste columns of data together because, in real-life analyses, each spreadsheet contains a different number of people. (Don’t you just love missing data?)
This magical formula allows you to combine those different spreadsheets, tabs, or data tables into a single contiguous dataset that you can use for your tabulations.

Vlookup Isn’t Easy
A disclaimer: vlookup has a learning curve.
I first learned this function from Agata Jose-Ivanina when we were working together back in 2008. Bless her heart, she explained and re-explained the function to me a million times. I practiced on my own, and finally–probably a full month later–I got it.
So don’t worry if this function seems tricky at first. Eventually everything will click in your brain, and you’ll be on your way to saving hours and hours of your time.
Vlookup Needs 4 Things
The function contains four pieces of information.
It looks like this: =vlookup(lookup_value,table_array,col_index_num,range_lookup).
And here’s what each piece of the function really means:
- lookup_value: The cell that contains the person’s ID number. The ID numbers are the link or key that connect all the spreadsheets together. The ID numbers must be located in the first column of each table – in the first column of your new combined dataset and in the first column of every single table from which you’re pulling data.
- table_array: This is the table from some other spreadsheet or other file from which you’re pulling data.
- col_index_num: This is the column in that table where you’re pulling the data from. Just type in the number of the column. For example, if you want to pull in data from Column C of another table, you’d type “3.”
- range_lookup: Always type “false” and you’ll be in good shape.
When to Use Vlookup
Check out these three step-by-step tutorials to learn more.
I’ve purposefully repeated content through the tutorial series so that you can hear the information multiple times in multiple ways.
Why to Use Vlookup
How to use =vlookup():
Advanced Vlookup Time-Savers
Comfortable with vlookup?
Apply time saver #1 and time saver #2 to take your spreadsheet to the next level.
Hlookup
Then, try your hand at hlookup.
Hlookup is essentially the same as vlookup, but the data table is rotated on its axis:
- vlookup is for vertical datasets (the ID numbers go up and down in a column) and
- hookup is for horizontal datasets (the ID numbers go left to right in a row).
Bonus! Download the Materials
Want to practice these skills? You can purchase the spreadsheets used in the videos.
Purchase the Spreadsheets From the Tutorial Videos
3 Comments
Vlookups consumed my life the last few months of my most recent CQI/Eval position. Very helpful and quite the time saver once you get the hang of it though. Thanks for sharing these tips and congrats on 100,000 views!
Ann, I think you’re rather underselling the VLOOKUP function by saying that it is for merging and combining datasets. Sure you can use the function for such tasks, and these don’t need to be as extensive as your example (e.g. you may just wish to add a single value which is returned from another table/database) but it can do more than that – like grading raw numeric scores into brackets/bins, returning the appropriate income tax or commission rate for a given level of income or sales, etc.
VLOOKUP is a great function, though – like most other Excel functions – it does have its limitations and traps for new players.
Vlookup is the star function, but I prefer Index & Match. It can do all that Vlookup does, plus a lot more