
For the record, I had no clue that data visualization could be easy.
As someone who’d spent two years working to understand and improve an organizational dashboard (not to mention an evaluation process), perhaps I should have known better. My assumption, for whatever reason, was that data visualization required some sort of training in graphic design…or programming…or statistics. Maybe a combination thereof. Honestly, I didn’t even know what skills you needed to create this “magic.” All I knew was that I didn’t have ‘em.
What’s more is that I figured it required some fancy software or program.
So imagine what came to mind when Ann told me she could do nearly everything using Excel.
Naturally, my first thought was, “You’ve got to be kidding. You make all of THAT using programs I already know…?”
My second thought? “Alright, show me how.”
Here’s a glimpse what I was making before my world was upended. I had always been frustrated with Excel’s options so I usually avoided making graphs and charts all together.
Before: A Pie Chart with Six Slices and Default Formatting
Before attending Ann’s data visualization workshop, this is what I had been able to piece together: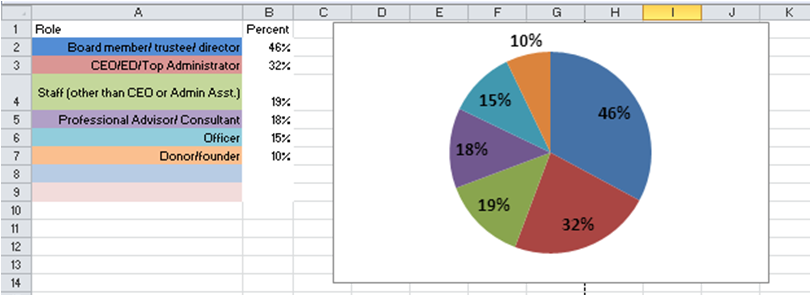
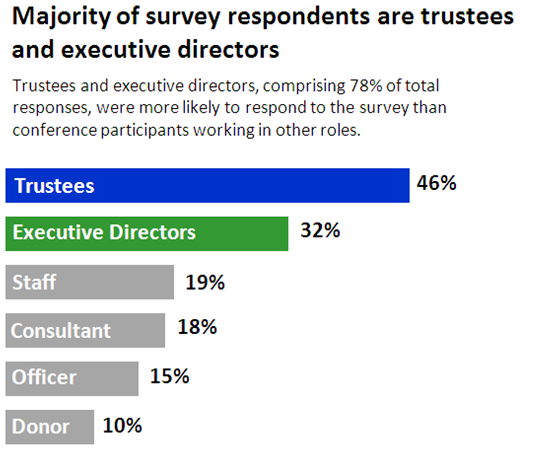
After: A Storytelling Bar Chart with Branding
A bit easier to interpret, wouldn’t you say? No searching for meaning or results–it’s right there at the top.
Now, I fully realize that this is just the tip of the iceberg. Could this be better? You betcha! Have I gotten better with practice? Absolutely.
But, in my opinion, the most important question to ask is, “Can I use data viz to better communicate starting today?”
And fortunately, the answer is yes. There’s no better way to do it than just throwing yourself into it and giving it a go.
So why wait?
1 Comment
Great intro. Thank you as well for directing me to Ann and Johanna’s presentation. Very helpful!