
Today’s article comes from Maryfrances Porter, Ph.D. & Alison Nagel, Ph.D of Partnerships for Strategic Impact. They were recently guest speakers in our Simple Spreadsheets course and had so many great insights! – Ann
—
Thank you to Ann Emery, Depict Data Studio, and her Simple Spreadsheets class for inviting us to talk to them about the use of statistics in nonprofit program evaluation! If there’s one thing that we never want to miss, it’s an opportunity to tell people their job is easier than they think!
This is why we created ImpactStory™ Coaching – because it’s actually within reach of small- and medium-sized nonprofits to be clear, confident, and convincing when talking about their impact!
It was also just nice to talk to a group of smart, creative, data-minded professionals who also (yes – that’s right – also) feel overwhelmed by the prospect of having to use statistics.
We used to think our feelings of statistical overwhelm in the nonprofit space was because we were wimps (even though we have literally taken a combined SIX YEARS of graduate-level statistics*).
But then we realized that much of the time, statistics just don’t have much of a role in nonprofit work. And here’s why!
Why Nonprofits Shouldn’t Use Statistics
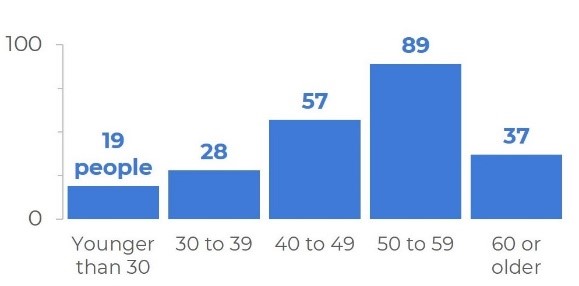
When working in the nonprofit world sample size is usually very small (i.e., the number of clients served in any given year is usually 40 to 400 people).
Even if you have more people than that (e.g., a school district’s worth of students), it’s still unlikely you need statistics, unless you are trying to answer a scientific-type question (and what scientific-type questions nonprofits with a lot of data might ask is for another blog post on another day).
Simply having a statistically significant group of survey respondents for such a small number of people means you have to get surveys from A LOT of people: 37 of 40 and 196 of 400! This is really hard to do (although we do have tricks for making sure you get surveys from almost 100% of your clients)!
Statistical significance is often mistaken to mean a big difference, but what it really means is a not random difference (e.g., if you looked at a different group of people, you’d find that difference again… it’s a reliable difference). When you have a small number of people, it also means you must have a GREAT BIG DIFFERENCE to get statistical significance.
The math just works out that if you look at 1 million people, just about any finding is statistically significant (e.g., a tiny difference in a big group is almost always not random), but when you’re looking at 100 people, you must have a really big difference to get statistical significance. In the science world, if you have a small group of people and do not find statistical significance, one thing you can do is test a much bigger group!

A Nonprofit’s Mission is to Serve as Many People as Possible to Address an Identified Need
In order to use statistics to identify the impact of a program, you usually need a comparison group (e.g., a random group of people who do not get the program) to which you compare your clients. Ideally, both groups are selected randomly: the people getting the program, and the people not getting the program. (We all know that’s not happening!)
Realistically, the comparison groups available to a nonprofit are either people the nonprofit randomly refused serve – or – a very nonrandom group of people who didn’t want the services the nonprofit was offering. Scientifically, neither of these are good options for comparison groups.
And we’ve never met a nonprofit so flush that they had money to track people they don’t serve. Even if a nonprofit had money to spare, spending this way would not be aligned with its mission to serve as many people as possible.

Nonprofits are Not Set Up to Follow People for a Long Time after Service Provision (e.g., 6 Months to 40 Years)
Most nonprofits provide a service for a specific amount of time, people graduate from that service, and then they go on with their lives (hopefully with more strategies to reach their goals). Staying in touch with people over time is very time consuming and very, very expensive – especially if you want to stay in touch with at least 80% of people (which is a minimum in the scientific world).
If you’re a smaller nonprofit that means you have to track 32 to 320 people over time (to follow up on those 40 to 400 clients you served). Frankly, this is both impossible and still too small to analyze with statistics (see point #1 about statistics with small groups of people).
Using scientific methods to test hypotheses (which are what statistics test) are what scientists do; delivering programming and tracking client progress is what nonprofit practitioners do.
We have used this example before: Scientists discover and test medicines to make sure they work. Doctors deliver what’s been shown to work and make sure the people they treat get better.
Two. Separate. Jobs.
You – our nonprofit friends – are doctors.
Nonprofits Focus on Working with Individual People and Complexity Not Populations and Averages (Which is the Realm of Science)
It’s a cognitive error to assume that statistics (which typically focus on averages) applies to individuals.
For example, the average number of car crashes a person gets into in a lifetime is four (this is scientific knowledge derived from statistics) – but we all know people who get in many more crashes and people who never get in a crash (this is the reality of being an individual in the complexity of life).
And, if you – as an individual – get into four crashes that does not mean that you are now immune to getting in crashes (this is the cognitive error of applying statistics to individuals)!
So, drive safe and buckle up!
Also, if you are concerned about diversity and equity then you need to have more people from marginalized groups from whom you gather data so you can really hear what they have to say. Period.
You do not want to just have a representative number (e.g., a number equal to the proportion in the larger population) because their voices get washed out in the average.
When doing nonprofit work: Each. Individual. Voice. Matters.
What Can Nonprofits Do?
Nonprofits Should Think of Themselves as Conducting Qualitative Analysis with Numbers and Stories
Qualitative analysis basically means you are looking for patterns and changes in patterns in both your numbers data (what people report on surveys) and your stories data (what people tell you in words).
You’re examining how the data look – the shape, the themes, the patterns that emerge, and when the patterns change.
Your Data Team is the litmus test for determining which things are important and meaningful and which things are not. Data Teams are for answering questions in real life; experimental design and statistics are for answering scientific questions. (Ask us more about Data Teams! We love to talk about them!)
You HAVE TO GRAPH Your Data to See How it Looks
If you do use math at all it’s probably only to calculate the percent difference, the percent change, and maybe a risk ratio. This means you count how many people say something and how many people didn’t say that.
Graph all the answers in both groups. Then break the groups up differently to better understand the patterns of responses (e.g., males and females, comparisons based on race or income or zip code or classroom or age. . . you get the picture). If you don’t graph your data, you’re sunk.
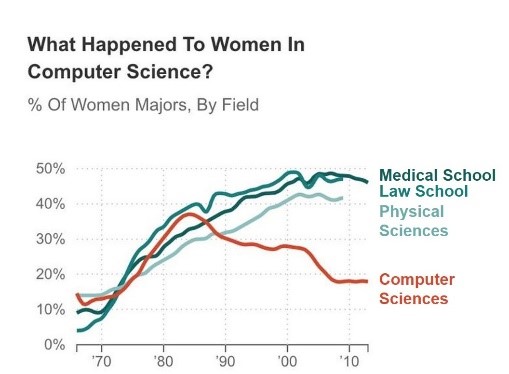
You simply have to graph it to see what it’s doing. Mostly bar charts (to compare groups) and line graphs (to look at stuff over time).
Here are some examples:
- Count how many people said “Strongly Agree” and “Agree” compared to “Disagree” and “Strongly Disagree.” What’s the percent difference between the two groups?
- Decide how different these counts are: meaningfully different or slightly different? The best way to make the most valid assessments of how meaningful the differences are is to use a Data Team. (We love a good Data Team!)
- Based on what you know about the people you serve, as well as changes in the community and at your organization, what do you think might be the reasons for those differences? (These are follow-up questions your Data Team can ask during their data review meetings.)
- Think about how you might divide the groups into different groups, or subgroups, to explore deeper questions (e.g., males and females, wealthy and financially struggling, graduated and not graduated, etc.). If you are looking at disparities, what’s the risk ratio of one group having a poor outcome compared to the other?
- If you have data over time (i.e., surveys from the same people at different times) – you may want to look at percent change happened over time?
What Software Should Nonprofits Use?
99% of the time. . . Excel.
If you have data with lots of complex relationships (e.g., data from parents and children, over time, in different programs) you probably want to be using a database like Apricot.
Then you can create and run reports that graph your data with the touch of a button! And you can still can create downloads of the data behind those reports and create your own graphs in Excel.
If you have many hundreds or thousands of people you are serving, then it’s just easier to clean and sort that data in a statistical package like SAS, SPSS, or R.
In these cases, we choose to hire someone who’s very good at these programs (like a graduate student taking a stats class) and pay them like $30-$40/hour to clean the data, maybe do some descriptive statistics and show us some averages. Then we have them download the clean dataset (a delimited CSV) and we pull that into Excel for graphing!
Tableau is great for being able to create dashboards you can manipulate and post on the web. But you actually have to know what graphs you want before creating them.
So, we’ll create the graphs we want (in Excel!), and then hire someone to transform the data and recreate those graphs in Tableau so nonprofit leadership can manipulate them or post them on the web.
We hope all this is some weight off your shoulders! Sign up here to stay connected with us and follow us on all the social media! We have lots more to share!
Connect with MaryFrances Porter & Alison Nagel
Partnerships for Strategic Impact: https://impactstorycoaching.com/
Maryfrances Porter, Ph.D. – LinkedIn: @maryfrances-porter-psi/
Alison Nagel, Ph.D. – LinkedIn: @alison-nagel-41493a125
2 Comments
Thank you very much for sharing this. Very interesting article that can be condensed into 3 or 4 statements. I have a question though. When considering an intervention with a group of say 50 individuals, women and men, and you want to know if there’s a difference in the way women and men respond to specific questions (i.e. difference due (in part) to gender), is it still possible to do tests for differences within groups and among groups, such as a Fisher exact test, or we are just using statistical tests that don’t make any sense with such a small sample?
Hi Gerardo!
You *can* use statistics anytime you want, it’s just that you might very well have an important finding that just isn’t statistically significant (and, honestly, vise-versa!). I would suggest that you look at the pattern of women’s and men’s responses and graph them. Do they look different? Is there a story behind them being similar or different? What percent different are they?
For example, if you found that men more often said they learned more from a male speaker, but that men and women equally learned from female speakers. If people, overall, generally learned the same amount from both speakers, then that would suggest you’d maximize learning by having female speakers. This would be true and important regardless of whether the difference between men’s and women’s learning was statistically different.
Does that help?