
“You should go work at Microsoft and fix Excel’s terrible formatting.”
I can’t tell you how many times I’ve heard this from workshop participants.
Bill Gates, are you reading this??
Microsoft Excel is lonnnnng overdue for some updates.
Don’t get me wrong—it’s still my favorite program. With 750 million users worldwide, I won’t be switching to anything else. It’s used by every business professional I know for at least part of their workflow.
Earlier this week, I was invited to guest lecture at Baruch College. Thanks to Professor Mahmoud Kamal Ahmadi for inviting me!
I’m normally very zen about data visualization. I expected to bring that peace of mind to Professor Ahmadi’s students.
Here’s my calm before the storm selfie:

“Sure, some of Excel’s default formatting is hard to decipher. And isn’t accessible for people with disabilities,” I’ve said a million times. “But with some behind-the-scenes editing, we can still make powerful visualizations inside Excel.”
I’m getting tired of making excuses for Microsoft.
Shouldn’t they know better by now??
I started to teach the Baruch College students about exploratory data visualization with conditional formatting. I couldn’t help but rant about the bad formatting as I went. It was 8pm at night. My filter had disappeared; I couldn’t help it. Sorry not sorry, Microsoft.
Wait, What’s Conditional Formatting??
Conditional Formatting is a fancy way of saying “if-then visuals.”
If the number is above 50, then fill the cell with red.
If the number is below average, make the font bold.
On and on.
Conditional Formatting is Ann K. Emery’s favorite button in Excel (along with the pivot tables button). It’s hiding in plain sight on our Home tab.
How to Use Conditional Formatting in Microsoft Excel
Conditional Formatting lets us create near-instant visuals.
These visuals are helpful for both exploratory and explanatory purposes. Exploratory data visualization is for us, the spreadsheet users and graph-makers. These near-instant visuals help us uncover patterns. Explanatory data visualization is typically for others, like our supervisor, Board of Directors, or other stakeholder groups. These near-instant visuals can be shared with others inside of dashboards, scorecards, and one-pagers to explain key findings to our audiences.
Here’s how to use Conditional Formatting in Microsoft Excel:
- Highlight or select some of the values in your spreadsheet. You can use Conditional Formatting on numbers, percentages, currency, and even words.
- Go to the Home tab.
- Click on the Conditional Formatting button.
- Choose one of the options, like Highlight Cells Rules, Top/Bottom Rules, or Data Bars.
- Enjoy your near-instant visual!
- Edit edit edit. With the cells still selected, go back to the Conditional Formatting button. On the very bottom of the list, you’ll see an option for Manage Rules. This is a fancy way of saying edit. You can adjust most aspects of your visual: the colors, the cutoff values, more.

Conditional Formatting in Microsoft Excel that Should Be Retired ASAP
Conditional Formatting is mostly excellent.
I love the speed. I love the instant understanding I get by seeing my numbers come to life.
But I hate hate hate the ableism.
Some of the Conditional Formatting options are terrible for people with color vision deficiencies.
Others are terrible for grayscale printing. (When was the last time you got excited about paying for colored ink cartridges?)
Others are just terribly busy-looking and could easily be improved with Graphic Design 101 skills.
Here are 24 of Excel’s conditional formatting techniques that should be retired ASAP.
These visuals are:
- too time-consuming to read,
- not accessible, or
- look like they’re from 1995.
3 Arrows (Colored)
Nice try, but so busy. I’ll show you something better in a moment.
3 Triangles
A bit easier to skim, but we can do better.
4 Arrows (Colored)
Why do the yellow arrows point in two different directions?

3 Arrows (Gray)
4 Arrows (Gray)
5 Arrows (Gray)
There’s nothing useful here. Don’t make me write three different sentences about why these three options are worthless.

3 Traffic Lights (Unrimmed)
I’m about to become really unpopular with 99% of people who make business dashboards, but….
We should really stop using traffic light color-coding altogether.
Green-red color combos aren’t accessible for people with color vision deficiencies (more on this later).
Sure, red-green combos are intuitive. For those of us who can see them. But they’re useless for everyone else.
3 Traffic Lights (Rimmed)
Let’s make the colors even smaller and harder to see.
Red to Black
These tones are confusing to me. Don’t we associate both red and black as “bad” colors? Why is red = high percentages? And black = low percentages? Sure, Excel lets us flip-flop these colors, but the question remains—aren’t red and black both “bad?”
4 Traffic Lights
Now, Excel is saying that black is even worse than red?? These inconsistencies kill me. And since when do traffic lights have 4 different colors? I’ve never seen a black lightbulb in a traffic light. So more for intuitive traffic light coding.

3 Signs
I want to love these. Although the 3 Signs design would technically pass 508 compliance accessibility guidelines (because our viewers aren’t relying on color alone—they can also see the different shapes) it’s still so busy.
There’s also the issue of combining both categorical coding (a diamond vs. triangle vs. circle) with diverging coding (red is worst, yellow is medium, green is best). Forgive the jargon, but as a research methods geek, this bothers me.
3 Symbols (Circled)
These tiny symbols would be impossible to skim at a glance in a tiny spreadsheet.
3 Flags
GAH. Probably the hardest to read from this bunch.
3 Symbols (Uncircled)
Maybe the easiest to skim from this bunch? But still a bit busy.

3 Stars
This design gets creativity points.
5 Quarters
These aren’t so bad to skim right now—because I’ve already organized the spreadsheet from lowest to highest. Imagine a mismatched list (e.g., 20%, then 80%, then 10%, then 50%….). It would get messy.
5 Boxes
There could be more contrast between the gray and blue, i.e., it would be easier to read if the gray was a bit lighter, or the blue a bit darker.
4 Ratings
I actually love bar and column charts for at-a-glance findings.
But, these would be easier to read if they were horizontal bar charts, not vertical column charts.
I’ll show you an example with horizontal bars in a moment.
5 Ratings
Same shortcomings here.

Data Bars (Gradient)
Speaking of bar and column charts… Do you see how much easier it is to compare bars than columns?
BUT, not these gradient bars. We need to retire these. The most important part of the bar chart is the right-most endpoint. So why does Microsoft fade these out to lighter colors… therefore making the most important thing harder to see???
Data Bars (Solid)
Winner winner chicken dinner! More of these, please.

Green-Yellow Red Color Scales
Yes, I know what you’re thinking. This stoplight coding is intuitive.
But only for those of us who can see red and green as distinct colors. For people with color vision deficiencies, this color scheme is worthless.
Let’s retire this ableist color scale from Excel.
Green-White-Red Color Scales
Not accessible. Ableist.
Blue-White-Red Color Scales
Better than the red-green color coding, since at least it’s legible for people with color vision deficiencies.
But, this wouldn’t print well in grayscale. More on this in a moment.
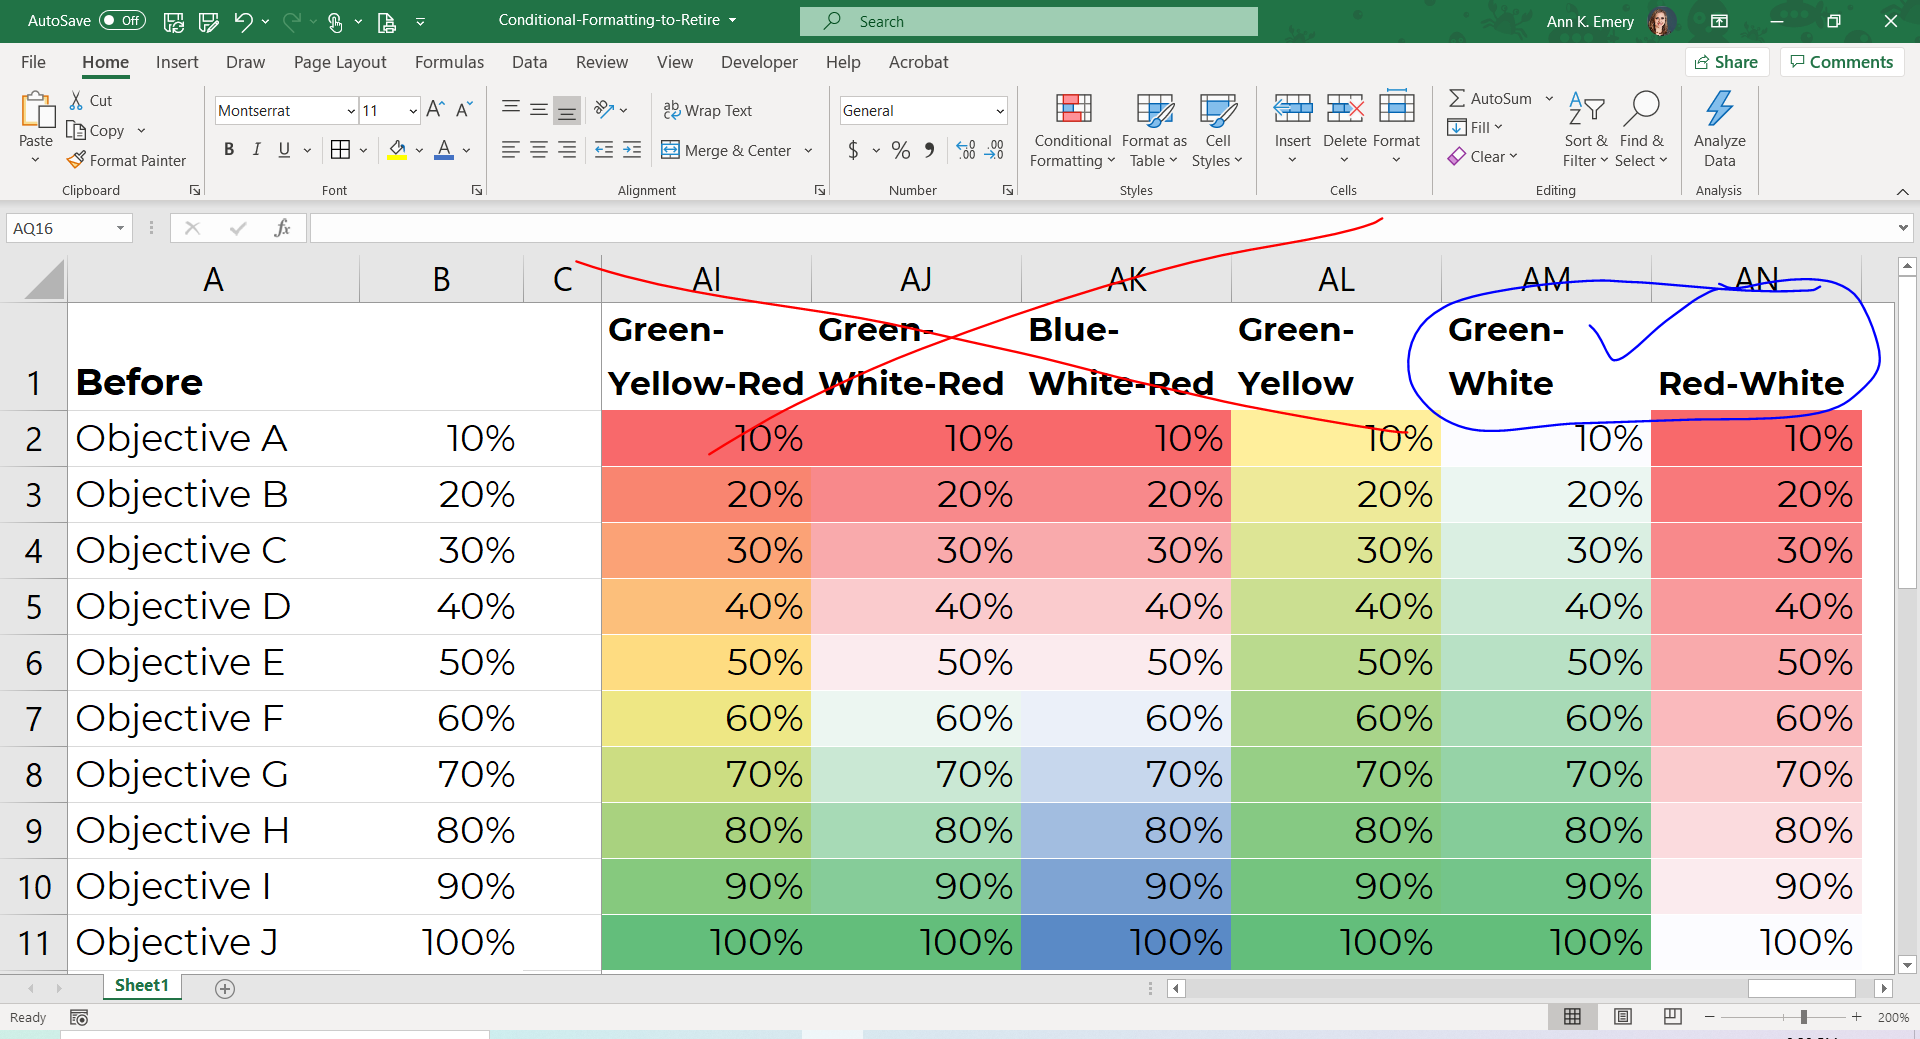
Green-Yellow Color Scale
Not horrible… but not as clear as it could be.
Green-White Color Scale
Winner winner chicken dinner! More of these, please.
Look at the green-yellow and green-white options next to each other.
Do you see how the green-white color scale is easier to read? The white is, well, whiter than the yellow. Therefore, there’s even more contrast when compared to the green.
This scale is colorblind-friendly and grayscale-friendly.
Red-White Color Scale
Winner winner chicken dinner! More of these, please.
This is the opposite tone of the green-white color scale.
In other words, use this color scale to emphasize that low = bad.
How about Grayscale Printing?
We should always assume that someone will print our visuals. That printing may happen in grayscale, not full color, to save money.
I did a quick grayscale test on these color scales to show you what they’d look like.
Do you see how the first three are worthless? The fourth one, green-yellow, is okay. The last two are the easiest to read.
(In Dataviz Jargon: Transform that diverging scale into a sequential scale. It’s harder to notice differences between two different hues, like red and blue, than to notice differences between gradations, like light green vs. dark green. And it’s impossible to read diverging scales in grayscale.)

How about Color Vision Deficiencies?
I also did a color-blindness check.
First, I uploaded a screenshot to the Color Vision Deficiency Simulator website.

Next, I investigated what the color scales would look like for someone with protanopia. Eek.
The first four are worthless.
Green-yellow is okay.
Green-white and red-white are best.

Well-Formatted Conditional Formatting in Microsoft Excel Worth Keeping
Keeping score? Here are the conditional formatting visuals we can keep using:
- Green-White Color Scale
- Red-White Color Scale
- Data Bars
I’ll add another keeper to the list: Squares and circles made with the Webdings symbol font.

For example, we can use Webdings g’s and the rept() function to create an icon array, as shown above.
Or, we can use Webdings g’s and c’s to create a series of filled-unfilled squares.
Or, we can use Webdings n’s to create a series of light-dark circles.
It’s faster to skim a list of filled-unfilled squares, or light-dark circles, than to skim the stars, flags, or mini column charts shown earlier.

How to Add Conditional Formatting to Your Microsoft Excel Spreadsheet
Want to create conditional formatting to explore initial patterns in your spreadsheet? Here are links to detailed tutorials:
- How to Create Data Bars in Microsoft Excel
- How to Make a Heat Table in Microsoft Excel
- More examples of easy-to-skim symbols and icons made with symbol fonts (Webdings and Wingdings)
- Webdings example: Re-envisioning a University’s Monthly Report: Two Reports with Two Different Purposes
- Webdings example: Visualizing Your Annual Survey Results: Four Makeovers That Didn’t Work, and the Fifth That Did
Your Turn
What are some additional features of Excel that should be retired? Or added?
1 Comment
3D!!!!