
When you’re working in the weeds of a spreadsheet, it can be hard to step back and find the bigger picture.
Here’s the approach I used in a recent training with a government client. Like all my custom workshops, attendees bring examples from their own projects that they’d like feedback on. Then, we remake those visualizations together during the session.
About the Project
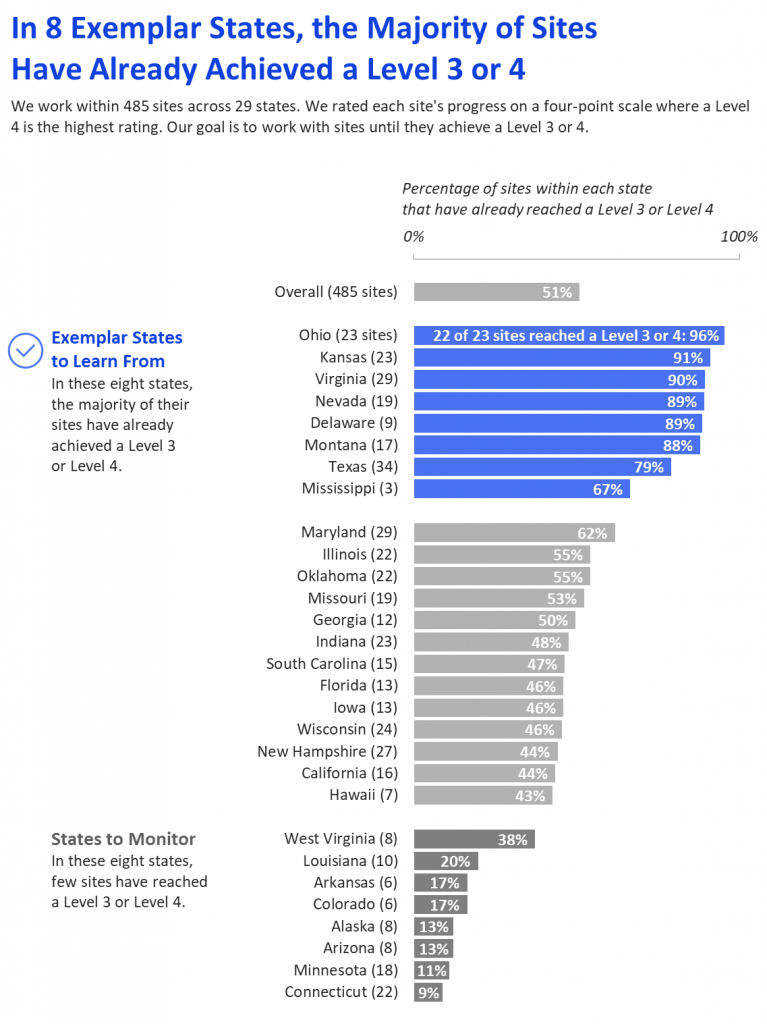
This government agency was running a program in 485 different sites across 29 states. (Well, sort of—I changed the numbers and state names for this blog post.)
They rated each site’s progress. We’ll pretend that they called those levels Level 1, Level 2, Level 3, or Level 4.
The goal was for each site to reach a 3 or 4.
Their spreadsheet was essentially organized like this:

Analyze the Audience
First, we considered our audience. I can’t go into too many details here, but let’s just say that their audience is high-up policymakers.
We didn’t want to pull their audience down into the weeds with us by examining each of the 485 locations individually. And we didn’t want to pull the audience down into the weeds by examining exactly how many sites or states hit a 1, or a 2, or a 3, or a 4. Those are the details that are needed by on-the-ground staff. Instead, our aim was to provide a high-level overview at the state level. For high-up leaders, I recommend starting with aggregate information. Then, the second page (or second slide) can dive into disaggregated data.
We also wanted the information to be actionable (duh). We wanted to design a one-page meeting handout that was not only clear but would also give the leaders something to talk about together.
Analyze the Data
After we narrowed down the intended audience, we analyzed the data.
The original dataset had one entry per site.
We used pivot tables to figure out how many sites within each state were at a Level 1, Level 2, Level 3, or Level 4.
For example, this pivot table shows that the agency was running the program in eight different sites in Alaska. Of those, seven sites were at a Level 1 and one site was at a Level 3.

We pasted the results from the pivot table into a new sheet and converted the numbers of sites into percentages of sites. Each state had a different number of sites. Transforming everything into percentages got us closer to an apples-to-apples comparison.

The Default Graph
Next, we built a stacked bar chart. The default chart tells us exactly nothing.

Declutter
Time to roll up our sleeves and edit! We removed the non-essential items so that our leaders would be freed up to focus on the important messages. We:
- Removed the generic title (which will get re-written later);
- Removed the border;
- Removed the 0% to 120% scale;
- Removed the legend;
- Removed the grid lines;
- Re-sorted the states from greatest to least (rather than alphabetical);
- Labeled only some of the bars (the percentage of sites that had already met our criteria);
- Made the chart bigger so that all the state names would actually be displayed; and
- Nudged the bars closer together.

Color
When used well, color is one of the most powerful elements of a graph. We:
- Began with colors that matched their logo (this exact shade of blue and red);
- Tested that color combo at color-blindness.com to make sure that people with color vision deficiencies could still distinguish between the blue and red (they can); and
- Color-coded the graph so that “good” states were in blue and the “bad” states were in red. We decided that states where two-thirds or more of their sites met the desired criteria would be blue and that states where one-third or less of their sites met the desired criteria would be red. We left a big chunk of states in a neutral color (this exact shade of gray from their style guide) because we decided that they wouldn’t be the focus of this visualization.

Text
Finally, we used text strategically. We:
- Wrote a storytelling title;
- Added a subtitle;
- Annotated the graph;
- Increased all the font sizes; and
- Reinforced the organization’s branding with their font (Corbel).
The annotations are my favorite part of this visualization. Our annotations help viewers interpret dense information, they’re color-coded in blue or red to match the “good” or “bad” section of the graph, and they include a discussion question for the meeting—what can we learn from eight exemplar states? We wanted the policymakers to think about what made the good states so good and to apply those lessons learned to the struggling states. (And again, I changed all the states and numbers, so don’t freak out if your state is at the bottom! It’s semi-fictional.)
The final graph is also sized appropriately for our meeting handout, which would be a Word document in portrait orientation. Word documents are 8.5 inches wide and 11 inches tall. This agency’s materials have 1-inch margins around all the edges, which left us with 6.5 inches of usable width space (8.5 inches minus 2 inches for margins) and 9 inches of usable height space (11 inches minus 2 inches for margins). In Excel, we went to Format and then Size and set the graph to be 9 inches tall and 6.5 inches wide.

The Finishing Touches
We sat on this draft for a day, and then came back to continue editing.
Here are the finishing touches.
We:
- removed the light shading (i.e., transformed the stacked bar chart back into a regular bar chart) for a sleeker appearance;
- added a legend above the graph;
- swapped out the Debbie Downer red for a less-in-your-face dark gray;
- added a check mark icon to help celebrate the eight states that already reached the goal;
- added white space between the three categories;
- moved the annotations from the right to the left side, so that we were leading with the narrative (rather than leading with the graphs);
- enlarged all the font sizes (from 11 to 12–because almost everyone wears glasses nowadays); and
- changed the font from Corbel to Calibri (due to a recent rebranding process in which all of their documents officially switched to Calibri).
Bonus: Download the Dataset and the Graphs
Explore my Excel file and use the graphs however you’d like.
Much more actionable than the original raw data, don’t you agree?
Leave a Reply