
It’s 3.14—Happy Pi(e Chart) Day!
If you’ve read this blog before, or heard me speak, then you know that designing data visualization makeovers is one of my favorite activities of all time.
I love redesigning pie charts, in particular.
The vast majority of data visualization trainings just advise people to stop using pie charts… without teaching people what to do instead.
Every year, I work with dozens of organizations, and every single organization still has pie charts sprinkled throughout their reports, slideshows, dashboards, and infographics.
Hearing that you’re supposed to avoid 3D exploding pie charts with a hundred tiny slices is beginner-level stuff. I need to train you on useful alternatives–that’s the advanced-level stuff.
I created this before/after pie chart makeover a million years ago but forced myself to wait until March 14 to share it. Phew! It’s been a long wait.
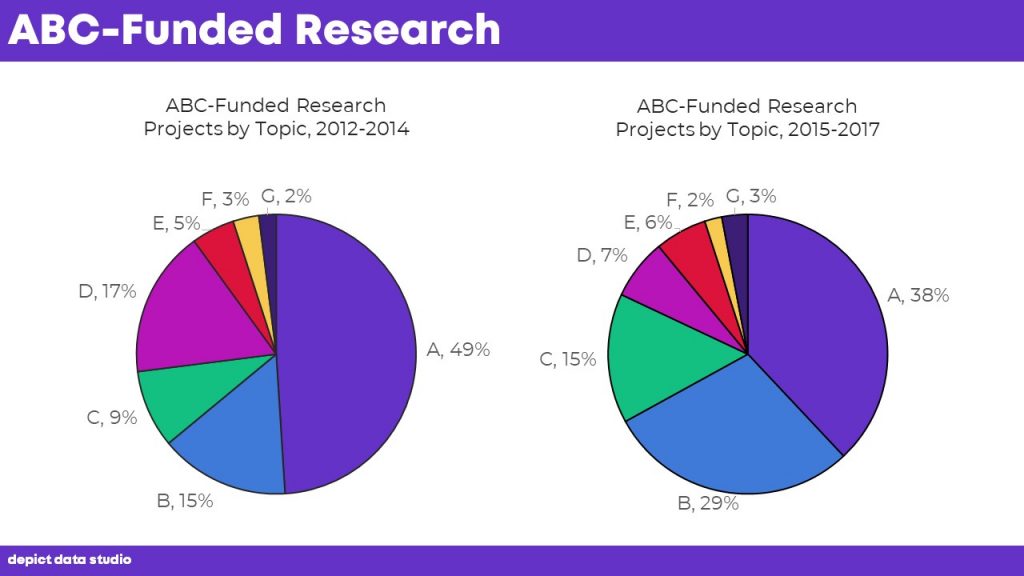
Before: Two Pie Charts
I recently worked with a grantmaking organization. They awarded grants to support various research projects. For anonymity, I’ve changed the names of the research projects to A, B, C, etc.
The grantmaking organization simply wanted to look for patterns in their funding over time.
Their “before” version looked like this:
Two Slices Only
A major guideline for pie charts is that they’re easiest to read with only two slices.
At the very least, we’d need to collapse the seven slices into just two slices. For example, you may choose to focus on research topic A with a dark-light contrast.
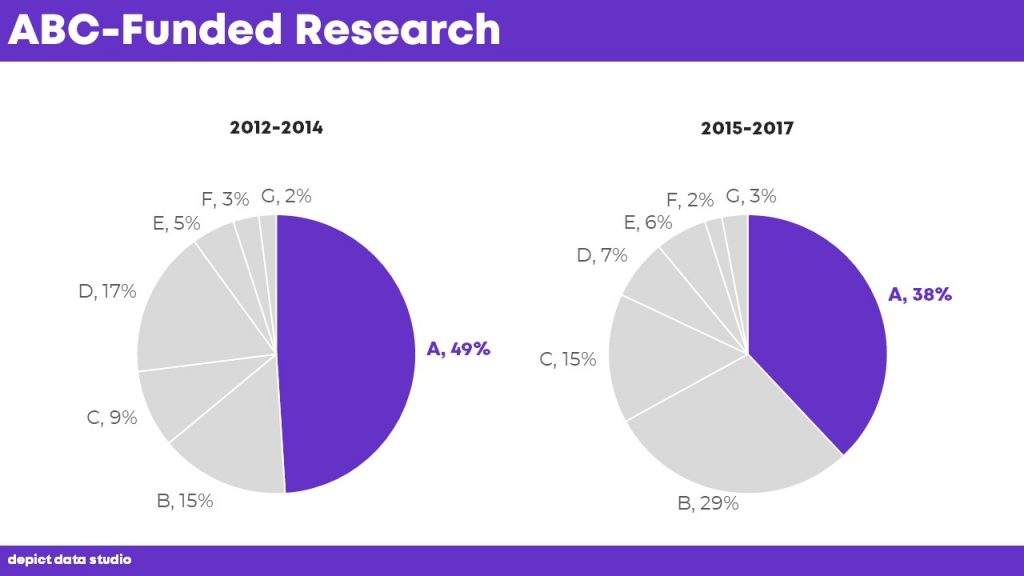
Dark-light contrast is helpful, but it’s not enough. We have to keep editing.
Don’t Make Viewers Zig-Zag Their Eyes Across Different Graphs
Another guideline—for all charts, not just pies—is that you don’t want to make viewers make comparisons across multiple charts.
If you want them to make comparisons, then put those things next to each other, not several inches apart from each other.
Here’s how my eyes have to zig-zag back and forth to read the original:

The collapsed, two-slice version still requires zig-zagging eye movements:

Let’s make the comparisons faster and easier.
The grantmaking team and I put our heads together. We came up with a few alternatives.
After: Stacked Columns
Being researchy types, the first alternative we came up with was stacked columns. Stacked columns are just rectangular versions of pie charts.

There’s nothing inherently wrong with stacked columns. But, yikes! This alternative felt way too busy. There are seven segments in each column, which is too many…
… unless…
…. you use dark-light contrast to focus your viewer’s attention one just one segment at a time.

After: Slope Graphs
Since we’re comparing patterns over time, how about a slope graph?
A slope graph is a fancy name for a line graph that has exactly two points in time.
Spaghetti Slope
Here’s what we tried:

Yikes! We had good intentions, but we accidentally created a spaghetti slope graph.
When this happens, don’t fret. It’s not your fault. It just means your particular dataset had percentages that criss-crossed and overlapped too much.
Spaghetti Slope with Highlighting
There are a couple ways to detangle spaghetti graphs.
One option is to guide viewers’ eyes to just one thing at a time with dark-light contrast:

Which line(s) will you highlight?
Use your best professional judgment.
Think about your unique audience. You might highlight something that increased, like B. Or you might highlight something that decreased, like D. Or, you might highlight something that remained steady over time—perhaps that thing was supposed to go up or down, but didn’t, and you’ve got an interesting story to discuss.
Small Multiples Slope
Another way to fix a spaghetti graph is with a small multiples layout.
Small multiples means multiple small charts.
You could produce seven mini charts, one for each of the seven research topics.
But better yet, let’s group them into categories that will give our viewers more insights into the patterns—the fact that some research topics received more funding while other topics received less funding.
I color-coded by category (one color for increases, another color for decreases).
Finally, I added icons to boost memorability.
This one’s my favorite. Swoon.

After: Dot Plot with Arrows
I intentionally sorted the categories into those that increased and those that decreased. It’s kind of like a small multiples dot plot.
I also included arrows, instead of just regular ol’ circles or dots, to reinforce the direction of the changes.
I color-coded by category (increases in one color, decreases in another color).
Finally, I added icons to boost memorability.

Join the Conversation
Team, you know the drill! Comment and let me know which alternative is your favorite and why. I’m personally drawn to the small multiples slope graph.

Bonus! Download the Materials
Purchase the spreadsheet that contains these graphs.
2 Comments
Great refresher, thanks.
Stephanie Evergreen likes “Proportion Plots”
https://stephanieevergreen.com/proportion-plots/