What do you foresee happening in the future of data visualization? Promising changes are underway. You can move the field forward and further your own professional development at the same time. In this article, we’ll cover a dozen practical ideas for improving your data visualization skills.
1. Commit to Easier-to-Read Layouts
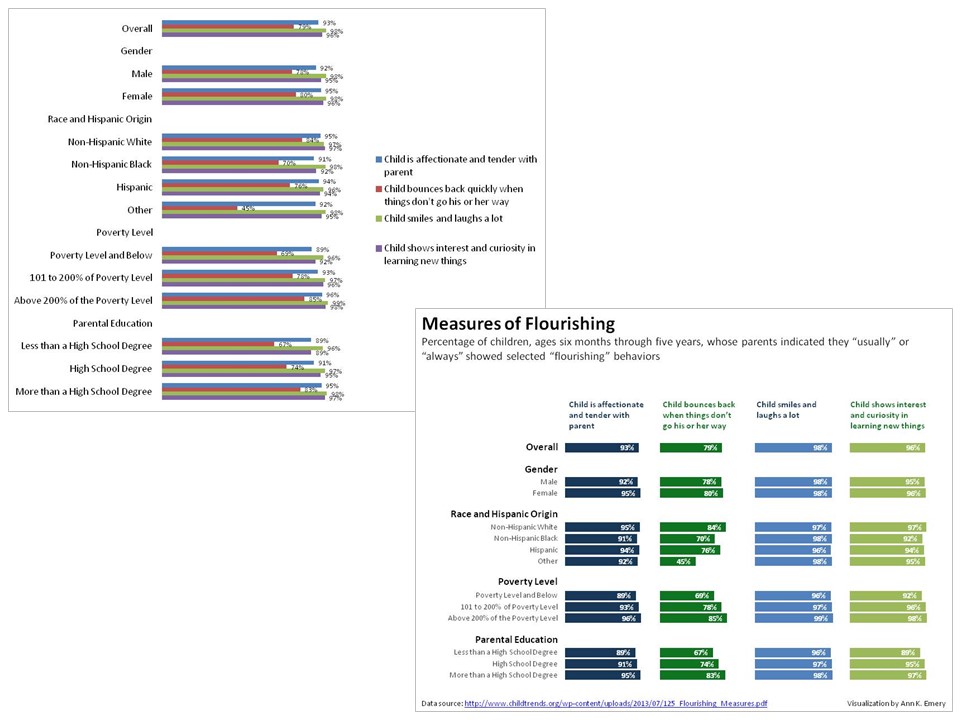
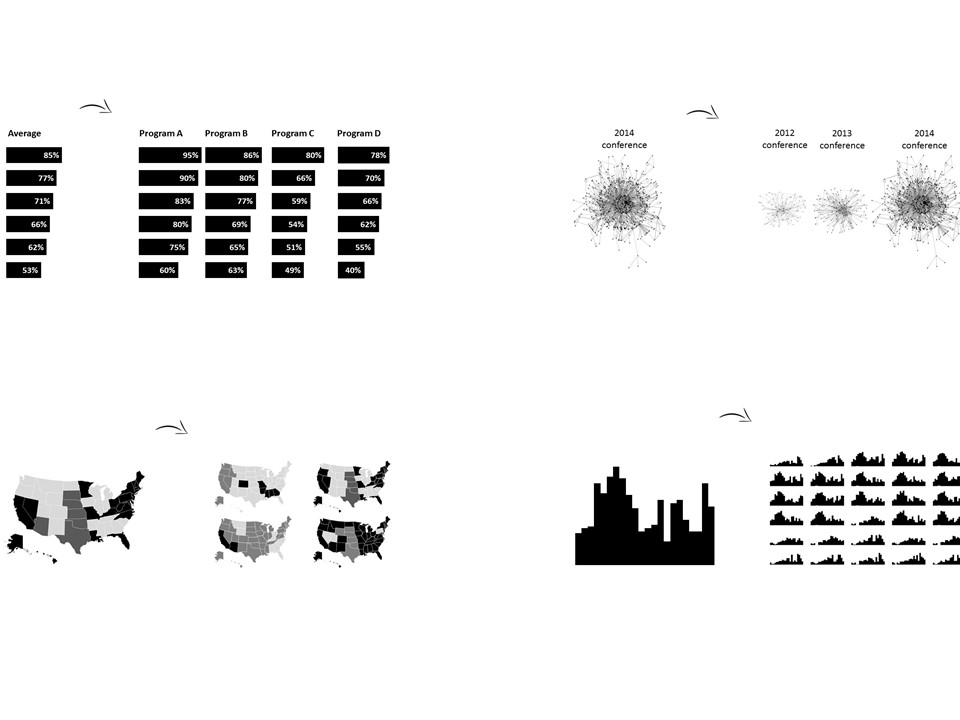
The end of clustered bar charts is near. I’m on a personal mission to banish these cluttered, impossible-to-grasp-at-a-glance graphs from your deliverables.
This year, resolve to swap your clustered bar chart for a small multiples bar chart, slope graph, or dot plot.
2. Try a New Graph Type
Try a new format, just for fun, then hide it away for a few weeks and forget about its shiny new novelty before sharing it with viewers. Tree maps, social network maps, Sankey diagrams, and more! Shiny! New! Fun amazing toys! How pretty! Give each of these chart types an honest try during your lunch break. But please don’t use them just because they’re cool. Use them when they’re the clearest chart for your viewers.
3. Share Disaggregated Findings in Addition to Aggregated Findings
Small multiples layouts involve multiple small charts, like one chart per company, school, city, or department that you’re reporting on.
Repeat with me: “It doesn’t matter if it takes a little longer to produce a small multiples layout. This is the information my viewers want and need–the details about their specific program, not the means and medians from all the groups lumped together–so my extra effort will pay off tenfold.”
4. Stop Looking for the Perfect Data Visualization Book
Stop looking for the perfect visualization book that will answer all of my questions and transform me into a visualization guru overnight. The field is young. A good number of visualization professionals have written books, and dozens of partnerships for new books are in the works. In the meantime, turn your attention to blogs and tweets.
Here are my highly-recommended blogs for non-programmers who want to get more from common software tools like Excel:
And here are my highly-recommended Twitter accounts:
5. Stop Looking for the Perfect Data Visualization Software Program
One day soon, we’ll stop arguing about which software program is best, and we’ll agree that our brains are the best visualization tools of all time.
One day, in a galaxy far, far away, the software salespeople will also stop pretending that their tool is best. Until then, resolve to speak up when you hear their crazy claims.
6. Don’t Trust Your Software Program’s Default Settings
On a related note… As novices, the first few times we use a software program, we’re tempted to trust the program. We might think, “I don’t really understand how this 3D/bevel/shaded chart is effectively communicating my message, but the software company must be full of experts, so I’ll just go with it.” It’s no secret that you’ll need to adjust almost every one of Excel’s default settings to produce something clear and comprehensible. Keep questioning Tableau, R, SPSS, and others, too.
7. Take Your Data Analysis and Data Management Skills to the Next Level
First comes planning… then comes identifying, modifying, or creating data collection tools and instruments… then data collection… then data cleaning…. then analysis… and, finally, data visualization–all while weighing stakeholder information needs, and building a data culture, and anticipating the best communications mode(s) for sharing the completed visualizations.
Do yourself a favor by building your foundational data management and analysis skills this year. Check out my pivot table webinars and spreadsheet tips, or take a course from one of my trusted fellow Excel gurus.
8. Embrace Ranges, Guesses, and Uncertainty in Your Dataset
Only have access to the minimum and maximum values in a dataset? Try a span chart. Want to graph the standard deviation? Add light shading above and below your values. Are you predicting what might happen down the road? Display the estimated range of values with light shading.
9. Don’t Forget to Visualize Your Qualitative Data
Create a chart, diagram, illustration, photograph, or cartoon to display patterns in qualitative data.
Experiment with strategies for displaying data from documents, interview transcripts, and focus group conversations, and you’ll be the next visualization rockstar. This is one of the most underdeveloped areas in the entire field of visualization.
I recently shared ideas for displaying qualitative data.
What do you think of the Washington Post’s simple color-coding for eyewitness statements? I’m a fan.
Visualizing the eyewitness statements: Did Michael Brown charge? http://t.co/dXrtGOcdUr via @postgraphics pic.twitter.com/45R2etOH1L
— Post Graphics (@PostGraphics) November 30, 2014
10. Give Virtual High-Fives to Data Visualization Designers You Admire
Like what you see? Tell the designer. Write them an email, comment on their blog post, send them a tweet, borrow Hedwig the owl. Your kind messages inspire new blog posts, conference presentations, and more, which keeps the field healthy and thriving.
Don’t like what you see? Shhh. Best to keep your thoughts to yourself. It’s bad karma and nobody wants to be friends with Debbie Downer.
11. Use Something Besides the Computer to Display Data
Some of my most valuable breakthroughs with organizations have come from drawing graphs on whiteboards during meetings.
Perhaps you’ve seen Hans Rosling’s 52-second explanation of population trends using stones.
You’re probably familiar with my affinity for sketching graphs on paper.
12. Create an Animated GIF or Video
Of course you’ve watched Hans Rosling’s 200 Countries, 200 Years, 4 Minutes video.
But have you seen the remake GIFs from Dark Horse Analytics? My personal favorite is their Clear Off The Table remake:
How about these changes-over-time GIFs from the L.A. Times Graphics Team?!? Swoon.
I’m also a big fan of this semi-animated, semi-interactive model of breast cancer causation. Well done, University of California researchers and designers. Here’s to hoping that we’ll see many more GIFs and videos in data visualization’s future.
Join the Conversation
Now it’s time to share your feedback: What are some other ways that you can improve your data visualization skills?
4 Comments
Great post.I suspect more interactive graphics will be coming soon. The Washington Post graph just gave me so many ideas!
Love it Ann! I definitely won’t miss clustered bars. And I love Clear off the Table – great lessons learned there – but seriously, I have to give up Calibri now? I’ve already given up Arial, and never loved Times New Roman to begin with. 😉
For more predictions, please read:
The Future of Dataviz: What’s in Store for 2015? (http://sheilabrobinson.com/2015/01/07/the-future-of-dataviz-whats-in-store-for-2015/) by Sheila Robinson on the Evaluspheric Perceptions blog
Data Visualization Predictions for 2015 (http://www.carsonresearch.com/data-visualization-predictions-for-2015/) by Taj Carson and Sarah McCruden on the Carson Research Consulting blog
The State of Information Visualization, 2015 (https://eagereyes.org/blog/2015/the-state-of-information-visualization-2015) by Robert Kosara on the Eagereyes blog
This is a fantastic list of goals/reminders and will definitely try my hand at all of them! Working with some grad students this spring who are conducting evaluation projects at local museums, and a big part of class will be centered around the Data Viz checklist, and Eval Report Checklist and your Excel for Evaluation tutorials. The best, and most easy to understand data analysis resources we’ve had! Keep it up Ann! (The GIF is a an awesome idea!)