1 Comment

  • […] You would also use your own colors, not mine. Learn how to read your organization’s style guide, locate your color codes with an eyedropper, or locate your color codes with Microsoft Paint. Then, enter your color codes in Excel or in Tableau. […]

  • Leave a Reply

    Your email address will not be published. Required fields are marked *

    Giving Your Tableau Visualizations a Makeover: Custom Colors

    Updated on: Nov 21st, 2017
    Dashboards
    , , , , ,

    Now you’ve got some fonts that aren’t basic, how about some custom colors? I really like matching my visualizations to my report, which is almost always based on the color scheme of the organization I’m working with. Let me tell you though, this can be a bit of a beast, so let’s get started.

    First, identify the colors you want to use. I suggest Adobe Color, which will allow you to upload a photo and get HEX codes (along with complementary colors and other fun things). Of course, you might be lucky and already have your HEX codes available.

    Next, you’ll need to determine whether you want to add a categorical, sequential, or diverging palette. I’ll show you categorical. You can add the others as needed using the same method.

    With your HEX codes in hand, locate your Tableau Repository. Depending on where you installed this, it could take a minute. When you locate it, there will be a Preferences.tps you need to open in a text editing program.

    With your HEX codes in hand, locate your Tableau Repository. Depending on where you installed this, it could take a minute. When you locate it, there will be a Preferences.tps you need to open in a text editing program.

    With your HEX codes in hand, locate your Tableau Repository. Depending on where you installed this, it could take a minute. When you locate it, there will be a Preferences.tps you need to open in a text editing program.

    Now, get started with code. You want to add the following before copying anything into the text edit.

    With your HEX codes in hand, locate your Tableau Repository. Depending on where you installed this, it could take a minute. When you locate it, there will be a Preferences.tps you need to open in a text editing program.

    You will need to copy the basic code down and insert your HEX codes. Tableau lists all the sets of you would possibly need here. Copy, paste, and customize.

    Here is the tricky part…

    Make sure you are using straight quotes. Anything else will cause all sorts of errors. I’ve included examples of a correct and incorrect repository. This is often not a matter of inserting quotes but changing the auto-correction in the program.

    Make sure you are using straight quotes. Anything else will cause all sorts of errors. I’ve included examples of a correct and incorrect repository. This is often not a matter of inserting quotes but changing the auto-correction in the program.

    Make sure you are using straight quotes. Anything else will cause all sorts of errors. I’ve included examples of a correct and incorrect repository. This is often not a matter of inserting quotes but changing the auto-correction in the program.

    Save and close your text editor and open Tableau! To test your colors, open up a sample dataset. On a worksheet, drag a dimension onto the Color Mark. You’ll immediately see those basic default colors but don’t worry – we’re fixing that!

    Save and close your text editor and open Tableau! To test your colors, open up a sample dataset. On a worksheet, drag a dimension onto the Color Mark. You’ll immediately see those basic default colors but don’t worry – we’re fixing that!

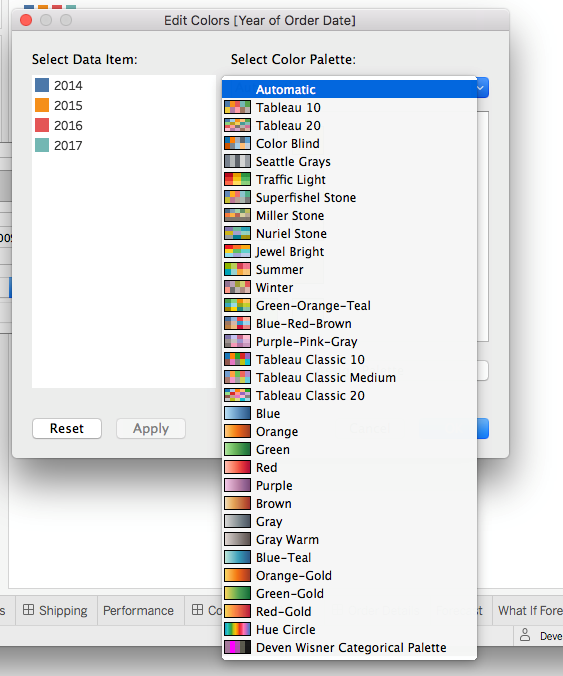
    Select the Color Mark and click Edit Colors. You should see yours at the bottom!

    Select the Color Mark and click Edit Colors. You should see yours at the bottom!

    Select your color and be sure to click Assign, otherwise nothing will change. Close the editor and check out your new colors!

    Select your color and be sure to click Assign, otherwise nothing will change. Close the editor and check out your new colors!

    SUCCESS!

    Select your color and be sure to click Assign, otherwise nothing will change. Close the editor and check out your new colors!

    If you followed along, you just completed some serious steps in customizing your Tableau visualizations. I call it a small but mighty change. You can go forth knowing that your visualizations are more customized and specific to your project!

    More about Deven Wisner
    Working with Deven is like working with an old friend. He looks out for your best interests, helps guide you toward good decisions, and sometimes—when you need it—lets you know when you’re wrong. He has the ability to make everyone around him feel comfortable, which makes partnering with him effortless and collaboration more than just easy, but fun. He believes building real relationships with clients is the secret ingredient to generating inspiration and action, and he pairs this belief with his background in evaluation, industrial-organizational psychology, and senior-level management experience to help both non and for-profits leverage data to make decisions that can change their organizations for the better. Outside of Viable Insights, Deven teaches Organizational Behavior and Psychology of Leadership at the University of Arizona, is a board member of the Arizona Evaluation Network, an active member in the American Evaluation Association, and co-founder of the Tucson Tableau User Group.

    1 Comment

  • […] You would also use your own colors, not mine. Learn how to read your organization’s style guide, locate your color codes with an eyedropper, or locate your color codes with Microsoft Paint. Then, enter your color codes in Excel or in Tableau. […]

  • Leave a Reply

    Your email address will not be published. Required fields are marked *

    You Might Like

    Our complimentary mini course for beginners to dataviz. Takes 45 minutes to complete.

    Enroll

    How to Apply Your Brand Colors in Dataviz (Ordinal, Diverging, Categorical, and More)

    Colors can make or break a chart. Colors direct our eye movements, and therefore our brains and attention. It’s up to you: will you help or hinder your reader’s understanding? Here are some simple strategies for communicating clearly with chart color.

    More »

    Want to wow your boss with a dynamic dashboard? Or, how about a one-pager of key findings? Our 4-course bundle provides all the how-to’s.

    Enroll

    Subscribe

    Not another fluffy newsletter. Get actionable tips, videos and strategies from Ann in your inbox.