Whether you are using Tableau, Excel, or any other visualization tool, you will come across defaults. The problem with using something right out of the can is that it often does not speak directly to your audience. Your investment in a visualization speaks to your investment in conveying the story of your data.
By now, you may know tips and tricks to de-clutter and minimize the amount of ‘out-of-the-box’ stuff in your Excel charts, but I want to share how to tackle the same problem in Tableau. It doesn’t take long to spot a Tableau visualization. Is that a bad thing? It depends (does that give anyone else grad school flashbacks?). Instead of being recognized for the font (Tableau Book) and colors that Tableau pumps out, have your Tableau visualizations recognized for their utility and story.
I’m going to share how to customize your fonts and colors within Tableau. And, make your life a lot easier (i.e. not changing one component of the visualization at a time.). Repeat after me: “I am better than the defaults.”
Let’s start with fonts, the easier change of the two.
Instead of having to change your fonts as you go, you can change the entire workbook. If you enjoy clicking on every area of your chart and changing the fonts, go ahead… but, I bet you’d rather spend that time on something else. You will also miss one or two! This way the entire book is the same font. You can adjust sizing as needed!
First, open your workbook.
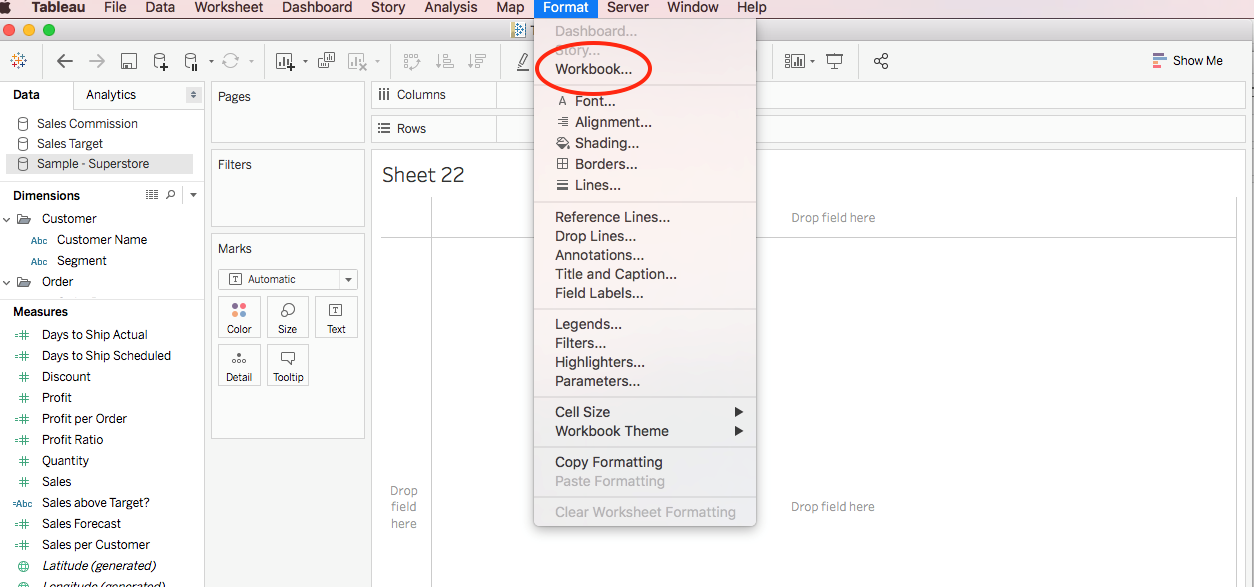
Go to Format in the top, right-hand corner and click Workbook.

On the right-hand side, you’ll have a formatting pane, which includes fonts, colors, and lines. Choose your font (I suggest a nice sans serif), and you’re ready to rumble!

1 Comment
[…] Now you’ve got some fonts that aren’t basic, how about some custom colors? I really like matching my visualizations to my report, which is almost always based on the color scheme of the organization I’m working with. Let me tell you though, this can be a bit of a beast, so let’s get started. […]