
Last year I teamed up with an organization on a custom design project. We wanted to show their leaders where one of their programs for children had been effective.
Like most in-house research teams, this team had a lot of data. The researchers had spent time on the ground in each country where their programming was offered. They collected data from children, parents, and program staff in both the treatment and control groups. Then, they did the math to see where the treatment group had outperformed the control group.
Our 30-page report for their leadership began with a short intro about the study. Then, we launched into the fun stuff, the results! We needed to provide an overview of where the program had been effective (where the treatment group had significantly better outcomes than the control group).
Before
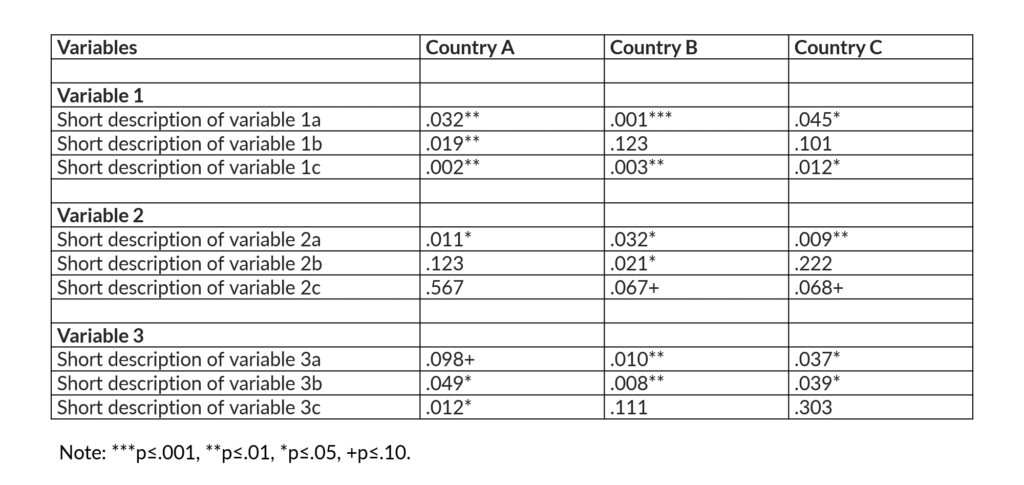
Here’s what the original one-page overview of the study’s results looked like. I made up fake values and hid the names of the variables, but you get the idea. There were a lot of p-values and decimal places.
I’m not going to define p-values. Heck, not even scientists can easily explain p-values! Basically, lower values are better.
After, the Bare Minimum
At the very least, we need to declutter the table. We removed the outer border. We removed the vertical lines. Notice how your eyes can still read down each column without the lines. We kept the horizontal lines, but we changed the black ink to light gray ink. We need the results to stand out, and the results can’t stand out if they’re hidden by unnecessary lines.

And at the very least, we need to apply color strategically. You should use your own organization’s colors so that your table (and the rest of your publication) will reinforce your brand. Throughout the report, we talked about the differences between the three countries, so we color-coded by country. In our tables, charts, and maps, Country A was always blue, Country B was always purple, and Country C was always turquoise. I’ve got another example of color-coding by category here.

After, the Winning Makeover
Here’s what our final makeover looked like. We decided to focus on the big-picture findings. So, we used empty squares to represent variables that weren’t statistically significant and filled-in squares to represent variables that were. We used p<.05 as our cutoff here; anything with .05 or lower got filled in and anything above .05 remained empty.
This was the first page of our Results chapter and we wanted readers to know what happened at a glance. Apply the Squint Test to both versions. Go ahead. Squint your eyes so that you’re peering at each table through your eyelashes. The asterisks from the original version are supposed to grab our attention and help us decode the information, but they end up looking so cluttered compared to the squares. Our brains can scan a page of squares faster than they can read a list of numbers and asterisks. Data visualization for the win!
And remember our audience: the organization’s internal leaders who were not researchers by training. These leaders had expertise in running organizations and launching programs around the world. They might’ve taken a couple research methods or statistics courses, but that would’ve been decades ago, and they don’t need to use those skills on a regular basis. They simply needed to know whether their treatment group had done better than their control group so that they could decide whether to expand, shrink, or adjust their approach to programming. They didn’t need the exact numbers in order to make those decisions. And I worry that providing the exact numbers can actually distract busy leaders from the big picture. The exact numbers go in the appendix of the report. The big picture findings go in the body of the report.

How We Created the Squares
Want to know our secret to producing the squares? We saved a million hours of time with Webdings. Yes, that crazy-looking font that you discovered back in 1999 and haven’t used since! In Webdings, a lowercase g gives you a filled-in square and a lowercase c gives you an empty square. I’ve used Webdings icons in a few dashboard projects and the results are easy to follow every time.
It was important to use existing icons within Microsoft Word. This was an internal report, and we didn’t want to slow down the writing process for the research team by making someone else reformat everything in a graphic design software program.
I made a list of all the shapes that are readily available to you through Webdings, Wingdings 1, Wingdings 2, and Wingdings 3 fonts. I highlighted a few of the most promising icons in yellow–but my favorite is the squares. There’s a link at the bottom of this blog post that allows you to download my spreadsheet for free.

The Runners-Up That We Considered and Tossed Aside
We experimented with a few drafts.
Circles: Too Time-Consuming to Create
Circles looked great, but they were a pain to create. We had to create individual circles using Insert –> Shape and make sure they were perfectly aligned within the table. Even making the fake version of the table for this blog post took me at least 15 minutes to get right. In comparison, creating the squares takes less than a minute because you’re just typing g’s and c’s and then changing the font to Webdings.

Check Marks: Too Hard to Scan at a Glance
Check marks and x’s looked too cluttered. In other words, they took longer to scan at a glance than the squares. There were too many diagonal marks all over the page.
And they were so small. We could’ve enlarged the font size of the check marks and x’s to make them more legible. But then we would’ve needed to enlarge the row heights in the table, too. The real version of this table included a couple dozen variables and it filled the entire page of the report. We didn’t want to enlarge the font size, and therefore enlarge the row heights, and therefore have the table spill onto the next page. The goal was to provide the exact right amount of information to the internal leaders. There’s something psychologically stressful about tables that last for more than a full page.

Thumbs Up and Thumbs Down Symbols: The Wrong Vibe
Finally, we experimented with thumbs up and thumbs down symbols. The non-researchers in the room loved the simplicity of this approach. But the researchers and I cringed because it gave off the wrong vibe. The thumbs down represents negativity. We didn’t want to say that something was bad just because it wasn’t statistically significant. The empty square represents an opportunity–an opportunity to do better and fill in the square.
The thumbs up and thumbs down symbols were tiny, too. Can you even see them here? I can’t, and I created the symbols in font size 18! We would’ve needed to enlarge the font size… and therefore enlarge the row height…. and therefore spill the table into a second page.

How are you transforming p-value tables for your non-technical audiences? Do you think any of these approaches would work for you? Leave a comment and let me know.
Bonus
Download the symbols.
Symbols Available with Webdings and Wingdings Fonts (Free Download)
Updates
Bogdan Miku (@trizniak) explored how we might visualize confidence intervals. Read his post: http://trizniak.blogspot.be/2018/02/confidence-intervals-for-effect-size_21.html
Dana Wanzer (@danawanzer) explored how we might visualize effect sizes. Read her post: http://danawanzer.com/visualizing-statistical-significance-and-effect-sizes/
11 Comments
I love seeing these stage by stage. Interesting to try and guess what the next change is as you scroll down.
Jeff, I’m so glad to hear that the stage by stage progression is helpful. In real life, the researchers and I drafted the various options together on a whiteboard. You should’ve seen my awful sketch of a thumbs-up and thumbs-down symbol… I’m not an artist but at least my attempts drew a few laughs. After a few minutes of sketching on the whiteboard, I turned to my laptop and showed them what the icons could look like once they were translated into Word. We had lots of “aha” moments during the session, so I tried my best to recreate our thought processes for blog readers.
If you want to use full circles / empty circles, there are options available in the Wingdings 2 set. Use the formula =CHAR(152) for a filled in circle and =CHAR(153) for an empty circle. =CHAR(154) will give an empty circle with a slightly thicker border, which may look better.
Andrew, what a creative solution. I just tried this in Excel and it was really straightforward. This blog post has screenshots from Word, though. Do you think there’s a way to create the circles entirely within Word (rather than in Excel)?
Hi Ann, you can insert the circles into Word using the Character Map in Windows (it sits under the “Windows Accessories” folder or just search for it in Win 10).
Pick out WingDings 2 as the font in the Character Map, click on the circles and press the “Select” button after clicking each one. You can then click the “Copy” button to add them to the clipboard and then paste them into Word
Sorry, after a quick play in Word, I realised that it has the character map built in now. Just go to the “Insert” menu on the ribbon and at the far right is a section to add in Symbols. Click the drop down and select “More Symbols” to get into the full character map.
Andrew, great thinking. I didn’t think about the Insert –> Symbol option. What a nice way to include circles without the added work of creating a bunch of shapes.
Thank you for the creative tip of using Wingdings for simple shapes like squares (and circles, apparently – thanks Andrew)! That is a huge time-saver!
I like the way of visualizing statistical significance as full or empty shapes. Do you have any tips on how to also visualize the direction (sign) and magnitude of the coefficients, not just the statistical significance or p-values? Would you split them up into two or three tables? For academic journals, I think we’re stuck with the old format of numbers and asterixes all in one table; but for decision-makers and lay audiences, it might be helpful to first show a table of statistical significance (vs. not), and a second table showing the direction and magnitude of the effect of only those variables that are statistically significant. But how would you choose to visualize those signs and numbers? I’m sorry if you already covered it in a previous post that I might have missed.
Hi Shadi, I haven’t tried that yet. You get to be the first one to figure out that approach! If you experiment, please post some drafts here so that we can all see them.
Will do! I tried earlier and wasn’t happy with the result. Next time I have a chance to experiment, I’ll share if I think it might be better. I’m certainly eager to read ideas and suggestions.
[…] significant p-values is often tricky. Khulisa recommends these tips these tips by Ann K. Emery on communicating statistical significance to non-technical […]